Elasticsearch, Logstash, Kibana or ELK Crash Course 101
Prologue aka Disclaimer
This blog post is the outcome of a Hackerspace Event:: Logstash Intro Course that happened a few days ago. I prefer doing workshops Vs presentations -as I pray to the Live-Coding Gods- and this is the actual workshop in bulletin notes.
Objectives
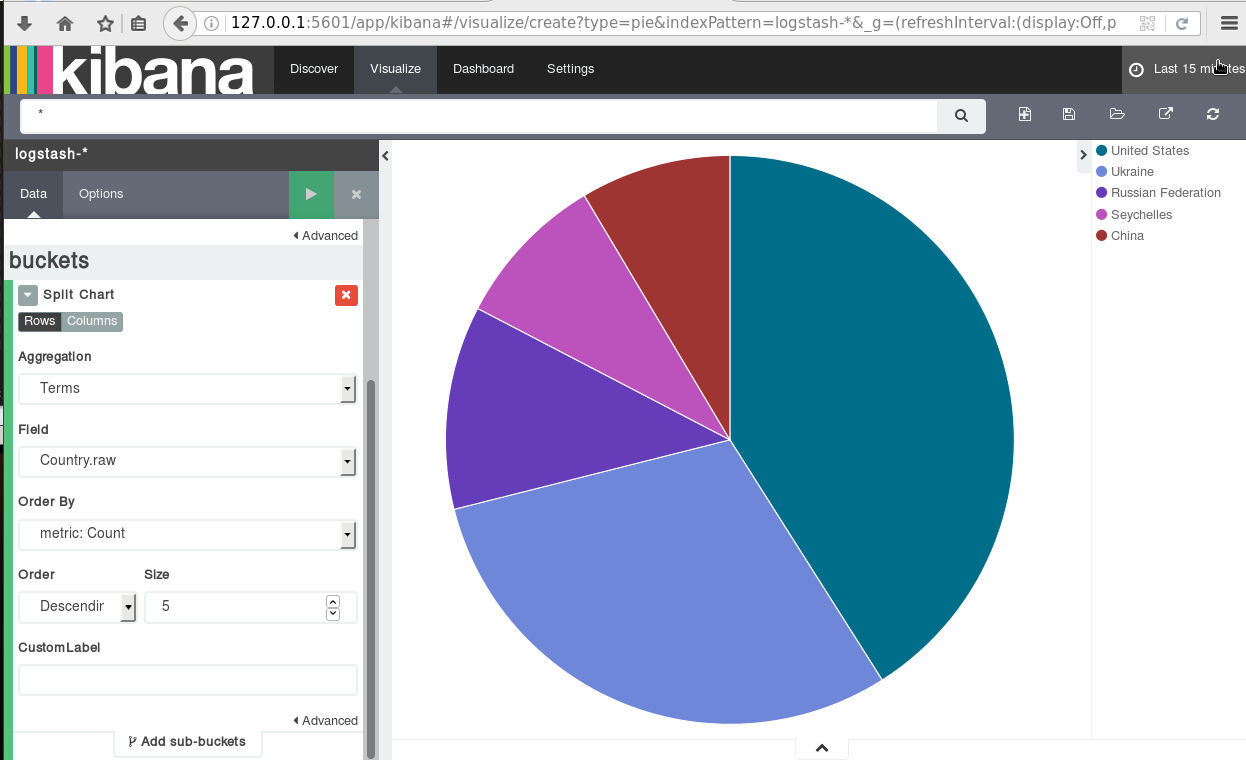
For our technical goal we will use my fail2ban !
We will figure (together) whom I ban with my fail2ban!!!
The results we want to present are:
| Date | IP | Country |
|---|
To help you with this inquiry, we will use this dataset: fail2ban.gz
If you read though this log you will see that it’s a grep from my messages logs.
So in the begging we have messages from compressed files … and in the end we have messages from uncompressed files.
But … Let’s begin with our journey !!
Prerequisite
For our little experiment we need Java
I Know, I know … not the beverage - the programming language !!
try java 1.7.x
# java -version
java version "1.7.0_111"
OpenJDK Runtime Environment (IcedTea 2.6.7) (Arch Linux build 7.u111_2.6.7-1-x86_64)
OpenJDK 64-Bit Server VM (build 24.111-b01, mixed mode)
In my archlinux machine:
# yes | pacman -S jdk7-openjdkVersions
As, October 26, 2016 all versions (logstash,elastic,kibana) are all in version 5.0.x and latests.
But we will try the well-known installed previous versions !!!
as from 5.0.x and later …. we have: Breaking changes and you will need Java 8
Download
Let’s download software
# wget -c https://download.elastic.co/logstash/logstash/logstash-2.4.1.zip

# wget -c https://download.elastic.co/elasticsearch/elasticsearch/elasticsearch-2.4.1.zip

# wget -c https://download.elastic.co/kibana/kibana/kibana-4.6.3-linux-x86_64.tar.gz
Logstash
Uncompress and test that logstash can run without a problem:
# unzip logstash-2.4.1.zip
# cd logstash-2.4.1

# logstash-2.4.1/
# ./bin/logstash --version
logstash 2.4.1

# ./bin/logstash --help
Basic Logstash Example
Reminder: Ctrl+c breaks the logstash
# ./bin/logstash -e 'input { stdin { } } output { stdout {} }'
We are now ready to type ‘Whatever’ and see what happens:
# ./bin/logstash -e 'input { stdin { } } output { stdout {} }'
Settings: Default pipeline workers: 4
Pipeline main started
whatever
2016-11-15T19:18:09.638Z myhomepc whatever
Ctrl + c
Ctrl + c
^CSIGINT received. Shutting down the agent. {:level=>:warn}
stopping pipeline {:id=>"main"}
Received shutdown signal, but pipeline is still waiting for in-flight events
to be processed. Sending another ^C will force quit Logstash, but this may cause
data loss. {:level=>:warn}
^CSIGINT received. Terminating immediately.. {:level=>:fatal}
Standard Input and Standard Output
In this first example the input is our standard input, that means keyboard
and standard output means our display.
We typed:
whateverand logstash reports:
2016-11-15T19:18:09.638Z myhomepc whatever
There are three (3) fields:
- timestamp : 2016-11-15T19:18:09.638Z
- hostname : myhomepc
- message : whatever
Logstash Architecture

Logstash architecture reminds me Von Neumann .
Input --> Process --> Output In Process we have filter plugins and in input pluggins & output plugins we have codec plugins
Codec plugins
We can define the data representation (logs or events) via codec plugins. Most basic codec plugin is: rubydebug
rubydebug
eg. logstash -e ‘input { stdin { } } output { stdout { codec => rubydebug} }’
# ./bin/logstash -e 'input { stdin { } } output { stdout { codec => rubydebug} }'
Settings: Default pipeline workers: 4
Pipeline main started

whatever

{
       "message" => "whatever",
      "@version" => "1",
    "@timestamp" => "2016-11-15T19:40:46.070Z",
          "host" => "myhomepc"
}

^CSIGINT received. Shutting down the agent. {:level=>:warn}
stopping pipeline {:id=>"main"}
^CSIGINT received. Terminating immediately.. {:level=>:fatal}
json
Let’s try the json codec plugin, but now we will try it via a linux pipe:
# echo whatever | ./bin/logstash -e 'input { stdin { } } output { stdout { codec => json }  }'

Settings: Default pipeline workers: 4
Pipeline main started

{"message":"whatever","@version":"1","@timestamp":"2016-11-15T19:48:44.127Z","host":"myhomepc"}

Pipeline main has been shutdown
stopping pipeline {:id=>"main"}
json_lines
# echo -e 'whatever1nwhatever2nn' | ./bin/logstash -e 'input { stdin { } } output { stdout { codec => json_lines }  }'

Settings: Default pipeline workers: 4
Pipeline main started

{"message":"whatever1","@version":"1","@timestamp":"2016-11-15T19:50:12.311Z","host":"myhomepc"}
{"message":"whatever2","@version":"1","@timestamp":"2016-11-15T19:50:12.324Z","host":"myhomepc"}

Pipeline main has been shutdown
stopping pipeline {:id=>"main"}
List of codec
Here is the basic list of codec:
avro
cef
compress_spooler
cloudtrail
cloudfront
collectd
dots
edn_lines
edn
es_bulk
fluent
gzip_lines
graphite
json_lines
json
line
msgpack
multiline
netflow
nmap
oldlogstashjson
plain
rubydebug
s3_plain
Configuration File
It is now very efficient to run everything from the command line, so we will try to move to a configuration file:
logstash.conf
input {
    stdin { }
}

output {
    stdout {
        codec => rubydebug
    }
}
and run the above example once more:
# echo -e 'whatever1nwhatever2' | ./bin/logstash -f logstash.conf

Settings: Default pipeline workers: 4
Pipeline main started

{
       "message" => "whatever1",
      "@version" => "1",
    "@timestamp" => "2016-11-15T19:59:51.146Z",
          "host" => "myhomepc"
}
{
       "message" => "whatever2",
      "@version" => "1",
    "@timestamp" => "2016-11-15T19:59:51.295Z",
          "host" => "myhomepc"
}

Pipeline main has been shutdown
stopping pipeline {:id=>"main"}
Config Test
Every time you need to test your configuration file for syntax check:
./bin/logstash --configtest

Configuration OK
fail2ban - logstash 1st try
Now it’s time to test our fail2ban file against our logstash setup. To avoid the terror of 22k lines, we will test the first 10 lines to see how it works:
# head ../fail2ban | ./bin/logstash -f logstash.conf
Settings: Default pipeline workers: 4
Pipeline main started

{
       "message" => "messages-20160918.gz:Sep 11 09:13:13 myhostname fail2ban.actions[1510]: NOTICE [apache-badbots] Unban 93.175.200.191",
      "@version" => "1",
    "@timestamp" => "2016-11-15T20:10:40.784Z",
          "host" => "myhomepc"
}
{
       "message" => "messages-20160918.gz:Sep 11 09:51:08 myhostname fail2ban.actions[1510]: NOTICE [apache-badbots] Unban 186.125.190.156",
      "@version" => "1",
    "@timestamp" => "2016-11-15T20:10:40.966Z",
          "host" => "myhomepc"
}
{
       "message" => "messages-20160918.gz:Sep 11 11:51:24 myhostname fail2ban.filter[1510]: INFO [apache-badbots] Found 37.49.225.180",
      "@version" => "1",
    "@timestamp" => "2016-11-15T20:10:40.967Z",
          "host" => "myhomepc"
}
{
       "message" => "messages-20160918.gz:Sep 11 11:51:24 myhostname fail2ban.actions[1510]: NOTICE [apache-badbots] Ban 37.49.225.180",
      "@version" => "1",
    "@timestamp" => "2016-11-15T20:10:40.968Z",
          "host" => "myhomepc"
}
{
       "message" => "messages-20160918.gz:Sep 11 14:58:35 myhostname fail2ban.filter[1510]: INFO [postfix-sasl] Found 185.40.4.126",
      "@version" => "1",
    "@timestamp" => "2016-11-15T20:10:40.968Z",
          "host" => "myhomepc"
}
{
       "message" => "messages-20160918.gz:Sep 11 14:58:36 myhostname fail2ban.actions[1510]: NOTICE [postfix-sasl] Ban 185.40.4.126",
      "@version" => "1",
    "@timestamp" => "2016-11-15T20:10:40.969Z",
          "host" => "myhomepc"
}
{
       "message" => "messages-20160918.gz:Sep 11 15:03:08 myhostname fail2ban.filter[1510]: INFO [apache-fakegooglebot] Ignore 66.249.69.88 by command",
      "@version" => "1",
    "@timestamp" => "2016-11-15T20:10:40.970Z",
          "host" => "myhomepc"
}
{
       "message" => "messages-20160918.gz:Sep 11 15:03:08 myhostname fail2ban.filter[1510]: INFO [apache-fakegooglebot] Ignore 66.249.76.55 by command",
      "@version" => "1",
    "@timestamp" => "2016-11-15T20:10:40.970Z",
          "host" => "myhomepc"
}
{
       "message" => "messages-20160918.gz:Sep 11 15:26:04 myhostname fail2ban.filter[1510]: INFO [apache-fakegooglebot] Ignore 66.249.76.53 by command",
      "@version" => "1",
    "@timestamp" => "2016-11-15T20:10:40.971Z",
          "host" => "myhomepc"
}
{
       "message" => "messages-20160918.gz:Sep 11 17:01:02 myhostname fail2ban.filter[1510]: INFO [apache-badbots] Found 93.175.200.191",
      "@version" => "1",
    "@timestamp" => "2016-11-15T20:10:40.971Z",
          "host" => "myhomepc"
}

Pipeline main has been shutdown
stopping pipeline {:id=>"main"}
fail2ban - filter
As we said in the begging of our journey, we want to check what IPs I Ban with fail2ban !!
So we need to filter the messages. Reading through our dataset, we will soon find out that we need lines like:
"messages-20160918.gz:Sep 11 11:51:24 myhostname fail2ban.actions[1510]: NOTICE [apache-badbots] Ban 37.49.225.180"so we could use an if-statement (conditional statements).
fail2ban - Conditionals
You can use the following comparison operators:

    equality: ==, !=, <, >, <=, >=
    regexp: =~, !~ (checks a pattern on the right against a string value on the left)
    inclusion: in, not in

The supported boolean operators are:

    and, or, nand, xor

The supported unary operators are:

    !

Expressions can be long and complex.
fail2ban - message filter
With the above knowledge, our logstash configuration file can now be:
logstash.conf
input {
    stdin { }
}

filter {
    if [message]  !~ ' Ban ' {
        drop { }
    }
}

output {
    stdout {
        codec => rubydebug
    }
}
and the results:
# head ../fail2ban | ./bin/logstash -f logstash.conf -v

{
       "message" => "messages-20160918.gz:Sep 11 11:51:24 myhostname fail2ban.actions[1510]: NOTICE [apache-badbots] Ban 37.49.225.180",
      "@version" => "1",
    "@timestamp" => "2016-11-15T20:33:39.858Z",
          "host" => "myhomepc"
}
{
       "message" => "messages-20160918.gz:Sep 11 14:58:36 myhostname fail2ban.actions[1510]: NOTICE [postfix-sasl] Ban 185.40.4.126",
      "@version" => "1",
    "@timestamp" => "2016-11-15T20:33:39.859Z",
          "host" => "myhomepc"
}
but we are pretty far away from our goal.
The above approach is just fine for our example, but it is far away from perfect or even elegant !
And here is way: the regular expression ‘ Ban ‘ is just that, a regular expression.
The most elegant approach is to match the entire message and drop everything else. Then we could be most certain sure about the output of the logs.
grok
And here comes grok !!!
and to do that we must learn the grok:
Parses unstructured event data into fieldsthat would be extremely useful. Remember, we have a goal!
We dont need everything, we need the date, ip & country !!
Grok Patterns
grok work with patterns, that follows the below generic rule:
%{SYNTAX:SEMANTIC}
You can use the online grok debugger: grok heroku
to test your messages/logs/events against grok patterns
If you click on the left grok-patterns you will see the most common grok patterns.
In our setup:
# find . -type d -name patterns
./vendor/bundle/jruby/1.9/gems/logstash-patterns-core-2.0.5/lib/logstash/patterns
./vendor/bundle/jruby/1.9/gems/logstash-patterns-core-2.0.5/patterns
the latest directory is where our logstansh instance keeps the default grok patterns.
To avoid the suspense … here is the full grok pattern:
messages%{DATA}:%{SYSLOGTIMESTAMP} %{HOSTNAME} %{SYSLOGPROG}: %{LOGLEVEL} [%{PROG}] Ban %{IPV4}grok - match
If you run this new setup, we will see something peculiar:
logstash.conf
input {
    stdin { }
}

filter {

#    if [message]  !~ ' Ban ' {
#        drop { }
#    }

    grok {
        match => {
            "message" => "messages%{DATA}:%{SYSLOGTIMESTAMP} %{HOSTNAME} %{SYSLOGPROG}: %{LOGLEVEL} [%{PROG}] Ban %{IPV4}"
        }
    }
}

output {
    stdout {
        codec => rubydebug
    }
}
We will get messages like these:
{
       "message" => "messages:Nov 15 17:49:09 myhostname fail2ban.actions[1585]: NOTICE [apache-fakegooglebot] Ban 66.249.76.67",
      "@version" => "1",
    "@timestamp" => "2016-11-15T21:30:29.345Z",
          "host" => "myhomepc",
       "program" => "fail2ban.actions",
           "pid" => "1585"
}
{
       "message" => "messages:Nov 15 17:49:31 myhostname fail2ban.action[1585]: ERROR /etc/fail2ban/filter.d/ignorecommands/apache-fakegooglebot 66.249.76.104 -- stdout: ''",
      "@version" => "1",
    "@timestamp" => "2016-11-15T21:30:29.346Z",
          "host" => "myhomepc",
          "tags" => [
        [0] "_grokparsefailure"
    ]
}
It match some of them and the all the rest are tagged with grokparsefailure
We can remove them easily:
logstash.conf
input {
    stdin { }
}

filter {

#    if [message]  !~ ' Ban ' {
#        drop { }
#    }

    grok {
        match => {
            "message" => "messages%{DATA}:%{SYSLOGTIMESTAMP} %{HOSTNAME} %{SYSLOGPROG}: %{LOGLEVEL} [%{PROG}] Ban %{IPV4}"
        }
    }

    if "_grokparsefailure" in [tags] {
        drop { }
    }
}

output {
    stdout {
        codec => rubydebug
    }
}
Using colon (:) character on SYNTAX grok pattern is a new field for grok / logstash.
So we can change a little bit the above grok pattern to this:
messages%{DATA}:%{SYSLOGTIMESTAMP} %{HOSTNAME} %{PROG}(?:[%{POSINT}])?: %{LOGLEVEL} [%{PROG}] Ban %{IPV4}but then again, we want to filter some fields, like the date and IP, so
messages%{DATA}:%{SYSLOGTIMESTAMP:date} %{HOSTNAME} %{PROG}(?:[%{POSINT}])?: %{LOGLEVEL} [%{PROG}] Ban %{IPV4:ip}logstash.conf
input {
    stdin { }
}

filter {

#    if [message]  !~ ' Ban ' {
#        drop { }
#    }

    grok {
        match => {
            "message" => "messages%{DATA}:%{SYSLOGTIMESTAMP:date} %{HOSTNAME} %{PROG}(?:[%{POSINT}])?: %{LOGLEVEL} [%{PROG}] Ban %{IPV4:ip}"
        }
    }

    if "_grokparsefailure" in [tags] {
        drop { }
    }
}

output {
    stdout {
        codec => rubydebug
    }
}
output will be like this:
       "message" => "messages:Nov 15 17:49:32 myhostname fail2ban.actions[1585]: NOTICE [apache-fakegooglebot] Ban 66.249.76.104",
      "@version" => "1",
    "@timestamp" => "2016-11-15T21:42:21.260Z",
          "host" => "myhomepc",
          "date" => "Nov 15 17:49:32",
            "ip" => "66.249.76.104"
}
grok - custom pattern
If we want to match something specific with to a custom grok pattern, we can simple add one!
For example, we want to match Ban and Unban action:
# vim ./vendor/bundle/jruby/1.9/gems/logstash-patterns-core-2.0.5/patterns/ebalACTION (Ban|Unban)and then our grok matching line will transform to :
logstash.conf
input {
    stdin { }
}

filter {

#    if [message]  !~ ' Ban ' {
#        drop { }
#    }

    grok {
        match => {
#            "message" => "messages%{DATA}:%{SYSLOGTIMESTAMP:date} %{HOSTNAME} %{PROG}(?:[%{POSINT}])?: %{LOGLEVEL} [%{PROG}] Ban %{IPV4:ip}"
            "message" => "messages%{DATA}:%{SYSLOGTIMESTAMP:date} %{HOSTNAME} %{PROG}(?:[%{POSINT}])?: %{LOGLEVEL} [%{PROG}] %{ACTION:action} %{IPV4:ip}"
        }
    }

    if "_grokparsefailure" in [tags] {
        drop { }
    }
}

output {
    stdout {
        codec => rubydebug
    }
}
output:
{
       "message" => "messages:Nov 15 18:13:53 myhostname fail2ban.actions[1585]: NOTICE [apache-badbots] Unban 41.82.165.220",
      "@version" => "1",
    "@timestamp" => "2016-11-15T21:53:59.634Z",
          "host" => "myhomepc",
          "date" => "Nov 15 18:13:53",
        "action" => "Unban",
            "ip" => "41.82.165.220"
}
mutate
We are getting pretty close … the most difficult part is over (grok patterns).
Just need to remove any exta fields. We can actually do that with two ways:
- grok - remove_field
- mutate -remove_field
We’ll try mutate cause is more powerful.
And for our example/goal we will not use any custom extra Action field, so:
logstash.conf
input {
    stdin { }
}

filter {

#    if [message]  !~ ' Ban ' {
#        drop { }
#    }

    grok {
        match => {
            "message" => "messages%{DATA}:%{SYSLOGTIMESTAMP:date} %{HOSTNAME} %{PROG}(?:[%{POSINT}])?: %{LOGLEVEL} [%{PROG}] Ban %{IPV4:ip}"
#            "message" => "messages%{DATA}:%{SYSLOGTIMESTAMP:date} %{HOSTNAME} %{PROG}(?:[%{POSINT}])?: %{LOGLEVEL} [%{PROG}] %{ACTION:action} %{IPV4:ip}"
        }
    }

    if "_grokparsefailure" in [tags] {
        drop { }
    }
    mutate {
        remove_field => [ "message", "@version", "@timestamp", "host" ]
    }
}

output {
    stdout {
        codec => rubydebug
    }
}
results:
{
    "date" => "Nov 15 17:49:32",
      "ip" => "66.249.76.104"
}
so close !!!
mutate - replace
According to syslog RFC (request for comments) [RFC 3164 - RFC 3195]:
In particular, the timestamp has a year, making it a nonstandard formatso most of logs doesnt have a YEAR on their timestamp !!!
Logstash can add an extra field or replace an existing field :
logstash.conf
input {
    stdin { }
}

filter {

#    if [message]  !~ ' Ban ' {
#        drop { }
#    }

    grok {
        match => {
            "message" => "messages%{DATA}:%{SYSLOGTIMESTAMP:date} %{HOSTNAME} %{PROG}(?:[%{POSINT}])?: %{LOGLEVEL} [%{PROG}] Ban %{IPV4:ip}"
#            "message" => "messages%{DATA}:%{SYSLOGTIMESTAMP:date} %{HOSTNAME} %{PROG}(?:[%{POSINT}])?: %{LOGLEVEL} [%{PROG}] %{ACTION:action} %{IPV4:ip}"
        }
    }

    if "_grokparsefailure" in [tags] {
        drop { }
    }
    mutate {
        remove_field => [ "message", "@version", "@timestamp", "host" ]
        replace => { date => "%{+YYYY} %{date}" }
    }
}

output {
    stdout {
        codec => rubydebug
    }
}
the output:
{
    "date" => "2016 Nov 15 17:49:32",
      "ip" => "66.249.76.104"
}
GeoIP
The only thing that is missing from our original goal, is the country field!
Logstash has a geoip plugin that works perfectly with MaxMind
So we need to download the GeoIP database:
# wget -N http://geolite.maxmind.com/download/geoip/database/GeoLiteCountry/GeoIP.dat.gz
The best place is to put this file (uncompressed) under your logstash directory.
Now, it’s time to add the geoip support to the logstash.conf :
  # Add Country Name
  # wget -N http://geolite.maxmind.com/download/geoip/database/GeoLiteCountry/GeoIP.dat.gz
  geoip {
    source => "ip"
    target => "geoip"
    fields => ["country_name"]
    database => "GeoIP.dat"
   # database => "/etc/logstash/GeoIP.dat"
  }
the above goes under the filter section of logstash conf file.
running the above configuration
# head ../fail2ban | ./bin/logstash -f logstash.confshould display something like this:
{
     "date" => "2016 Sep 11 11:51:24",
       "ip" => "37.49.225.180",
    "geoip" => {
        "country_name" => "Netherlands"
    }
}
{
     "date" => "2016 Sep 11 14:58:36",
       "ip" => "185.40.4.126",
    "geoip" => {
        "country_name" => "Russian Federation"
    }
}
We are now pretty close to our primary objective.
rename
It would be nice to somehow translate the geoip –> country_name to something more useful, like Country.
That’s why we are going to use the rename setting under the mutate plugin:
  mutate {
    rename => { "[geoip][country_name]"  => "Country" }
  }
so let’s put all them together:
    geoip {
        source => "ip"
        target => "geoip"
        fields => ["country_name"]
        database => "GeoIP.dat"
    }

    mutate {
        rename => { "[geoip][country_name]"  => "Country" }
        remove_field => [ "message", "@version", "@timestamp", "host", "geoip"]
        replace => { date => "%{+YYYY} %{date}" }
    }
test run it and the output will show you something like that:
{
       "date" => "2016 Sep 11 11:51:24",
         "ip" => "37.49.225.180",
    "Country" => "Netherlands"
}
{
       "date" => "2016 Sep 11 14:58:36",
         "ip" => "185.40.4.126",
    "Country" => "Russian Federation"
}
hurray !!!
finally we have completed our primary objective.
Input - Output
Input File
Until now, you have been reading from the standard input, but it’s time to read from the file.
To do so, we must add the bellow settings under the input section:
file {
    path => "/var/log/messages"
    start_position => "beginning"
}
Testing our configuration file (without giving input from the command line):
./bin/logstash -f logstash.conf
and the output will be something like this:
{
       "path" => "/var/log/messages",
       "date" => "2016 Nov 15 17:49:09",
         "ip" => "66.249.76.67",
    "Country" => "United States"
}
{
       "path" => "/var/log/messages",
       "date" => "2016 Nov 15 17:49:32",
         "ip" => "66.249.76.104",
    "Country" => "United States"
}
so by changing the input from the standard input to a file path, we added a new extra filed.
The path
Just remove it with mutate –> remove_field as we already shown above
Output
Now it’s time to send everything to our elastic search engine:
output {

    # stdout {
    #    codec => rubydebug
    # }

    elasticsearch {
    }

}
Be Careful: In our above examples we have removed the timestamp field
but for the elasticsearch to work, we must enable it again:
remove_field => [ "message", "@version", "host", "geoip"]Elasticsearch
Uncompress and run elastic search engine:
# unzip elasticsearch-2.4.1.zip
# cd elasticsearch-2.4.1/
# ./bin/elasticsearch
elasticsearch is running under:
tcp6       0      0 127.0.0.1:9200          :::*                    LISTEN      27862/java
tcp6       0      0 127.0.0.1:9300          :::*                    LISTEN      27862/java
Impressive, but that’s it!
Status
Let’s find out if the elasticsearch engine is running:
$ curl 'localhost:9200/_cat/health?v'

$ curl -XGET 'http://localhost:9200/_cluster/health?pretty=true'

epoch      timestamp cluster       status node.total node.data shards pri relo init unassign pending_tasks max_task_wait_time active_shards_percent
1482421814 17:50:14  elasticsearch yellow          1         1      1   1    0    0        1             0                  -                 50.0%

$ curl 'localhost:9200/_cat/nodes?v'

host      ip        heap.percent ram.percent load node.role master name
127.0.0.1 127.0.0.1            7          98 0.50 d         *      Hazmat

# curl -s -XGET 'http://localhost:9200/_cluster/health?level=indices' | jq .
logstash
Now it’s time to send our data to our elastic search engine, running the logstash daemon with input the fail2ban file and output the elastic search.
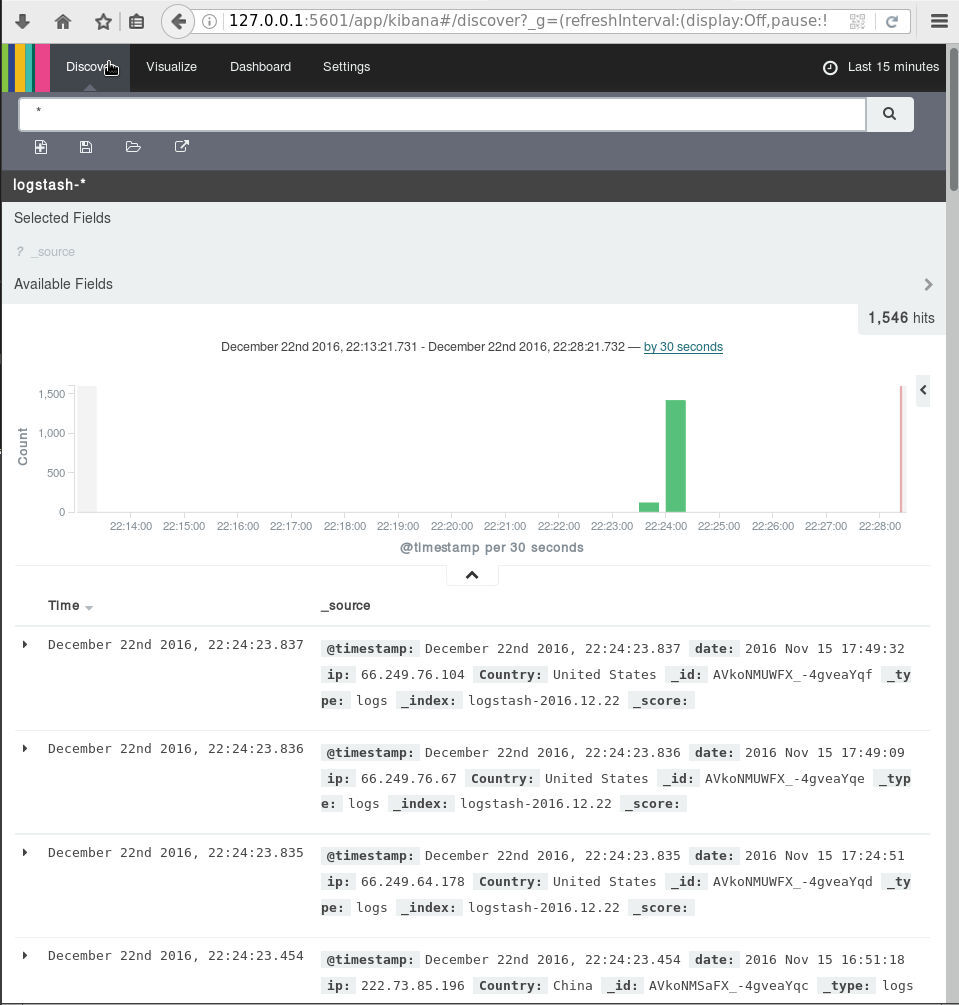
Kibana
We are almost done. There is only one more step to our 101 course for ELK infrastructure.
And that is the kibana dashboard.
setup kibana
Uncompress and run the kibana dashboard:
 tar xf kibana-4.6.3-linux-x86_64.tar.gz
 ./bin/kibana
dashboard
Now simply, open the kibana dashboard on:

A visual guide on how to enlarge your windows disk image aka windows extend volume
I have a windows 10 qemu-kvm virtual machine for business purposes.
Every now and then, I have to resize it’s disk image!
This is my visual guide, so next time I will not waste any time figure this out, again!
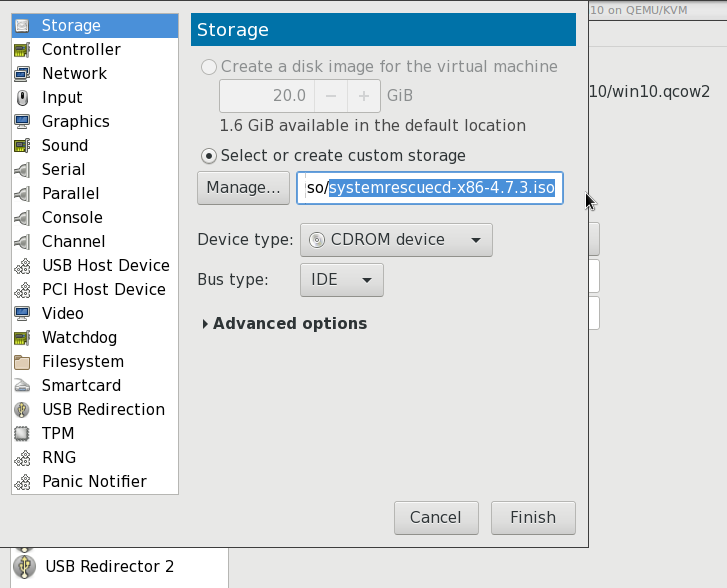
Resize Disk image
The first step is to resize the disk image from the command line:
# ls -l win10.qcow2
-rw-r--r-- 1 root root 58861813760 Nov 17 10:04 win10.qcow2

# du -h win10.qcow2
55G win10.qcow2

#  qemu-img info win10.qcow2
image: win10.qcow2
file format: qcow2
virtual size: 55G (59055800320 bytes)
disk size: 55G
cluster_size: 65536
Format specific information:
    compat: 1.1
    lazy refcounts: false
    refcount bits: 16
    corrupt: false
#  qemu-img resize win10.qcow2 +10G
Image resized.
# qemu-img info win10.qcow2
image: win10.qcow2
file format: qcow2
virtual size: 65G (69793218560 bytes)
disk size: 55G
cluster_size: 65536
Format specific information:
    compat: 1.1
    lazy refcounts: false
    refcount bits: 16
    corrupt: false
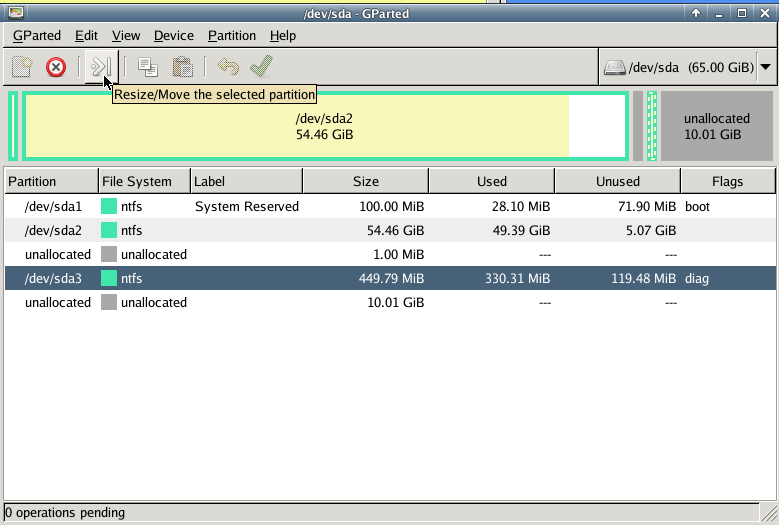
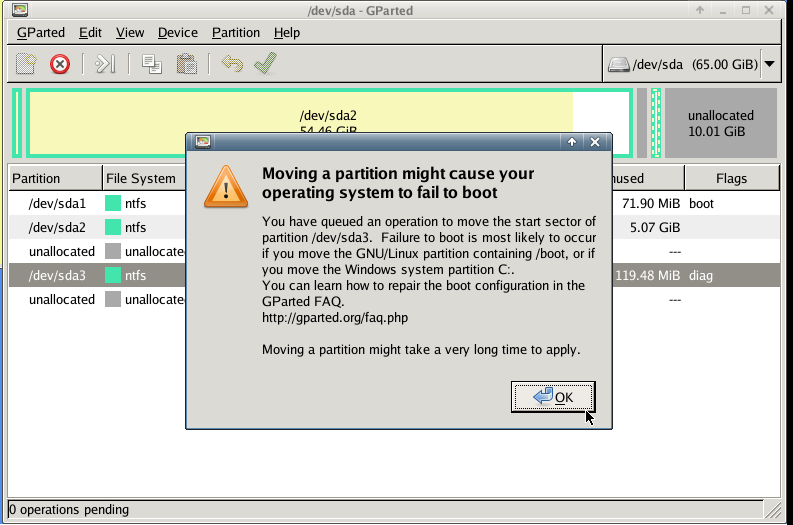
Windows Problem - extend volume
Windows can not extend a volume if the free partition is not next to the “need-to-be” extened volume.
So we have to move the free partition next to C: drive
System Rescue Cd
Here comes system rescue cd !
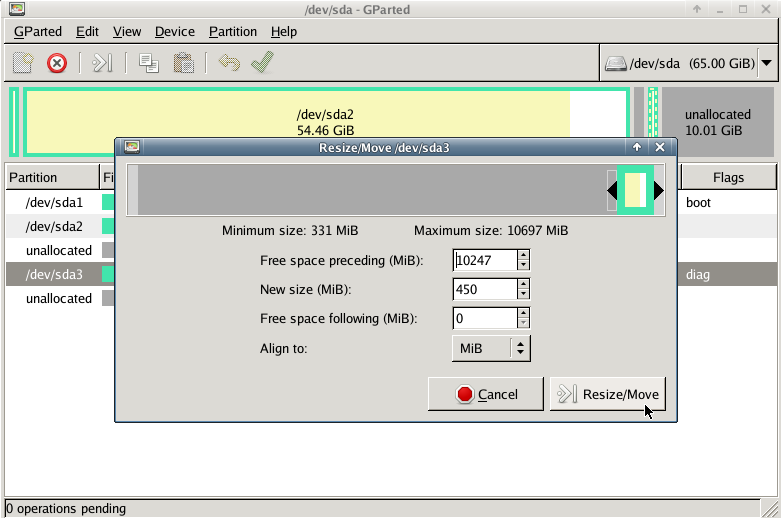
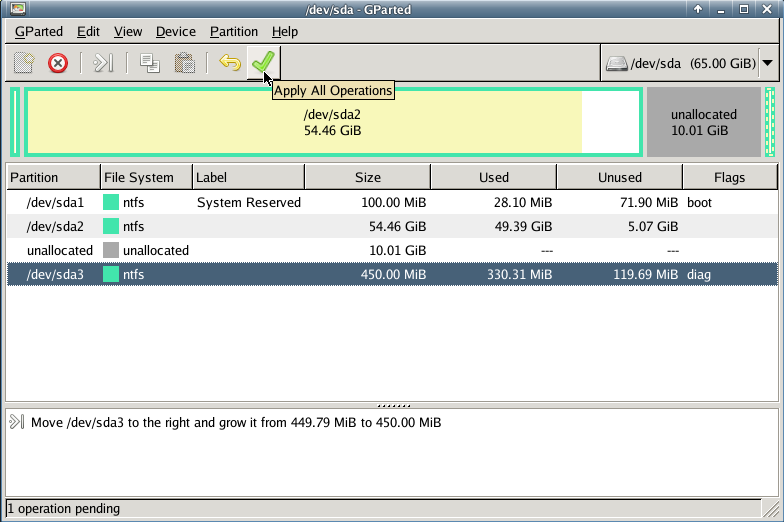
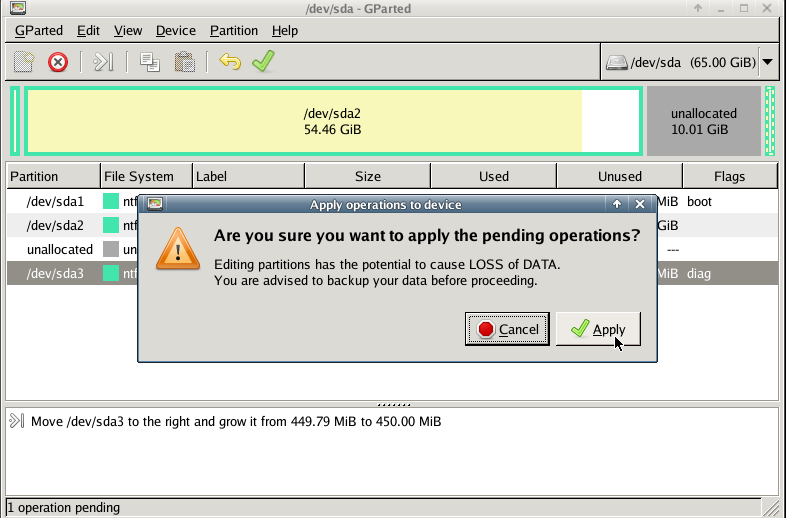
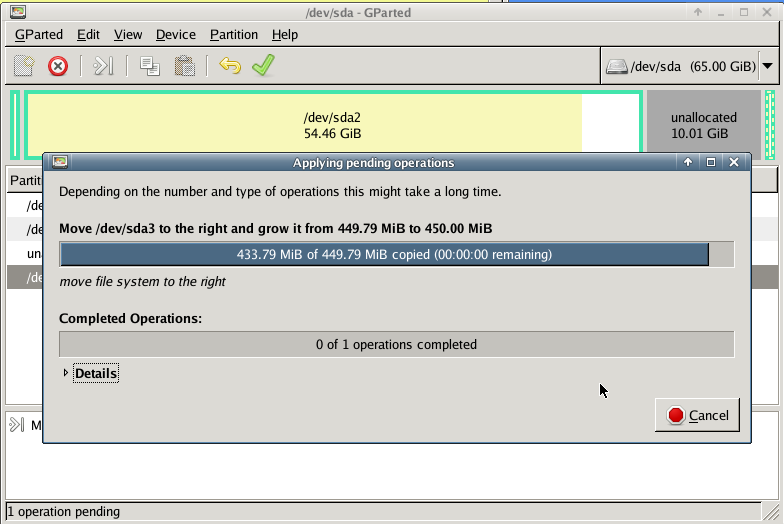
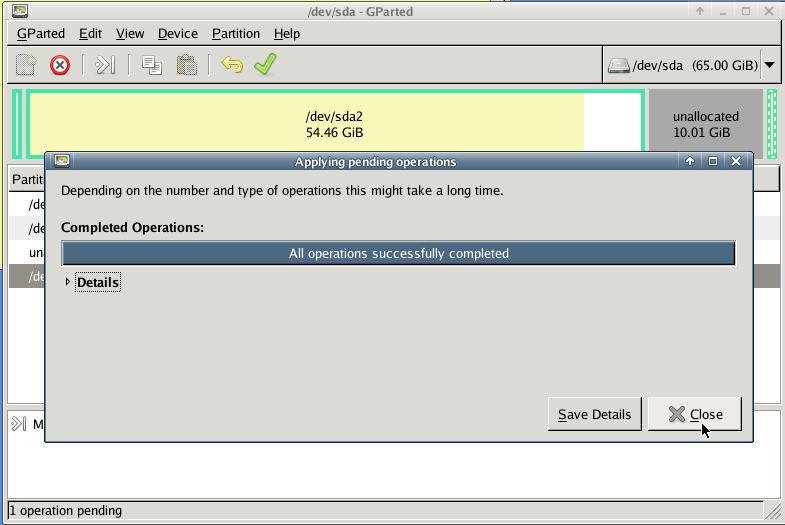
Gparted
with gparted you can move to the end of the virtual disk the ntfs recovery partition:
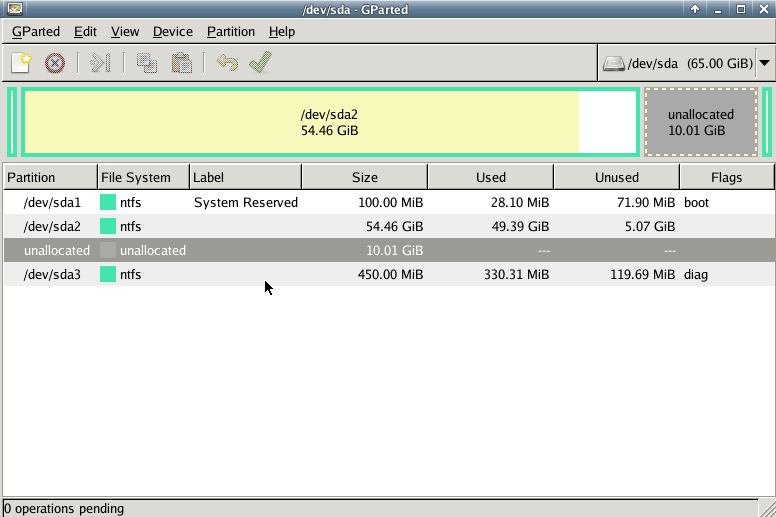
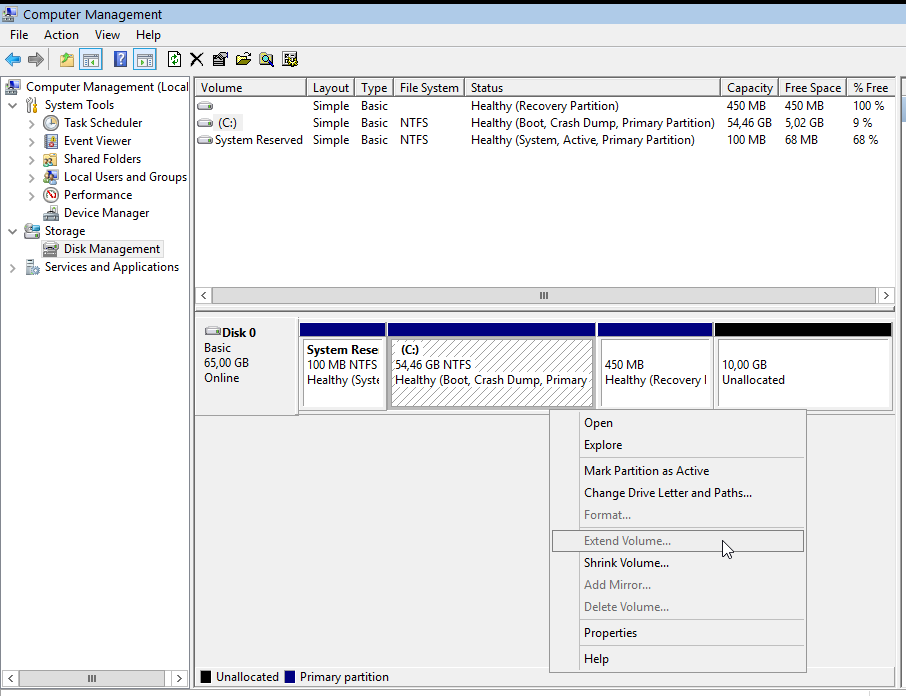
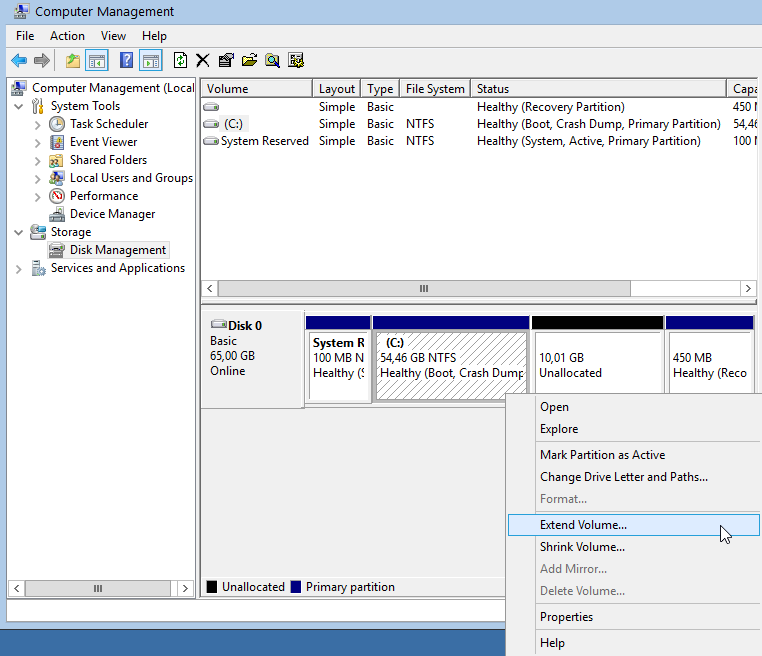
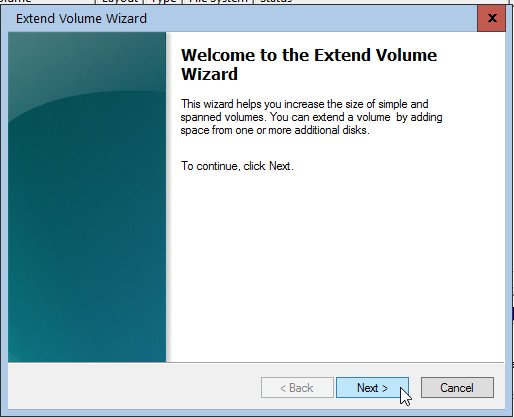
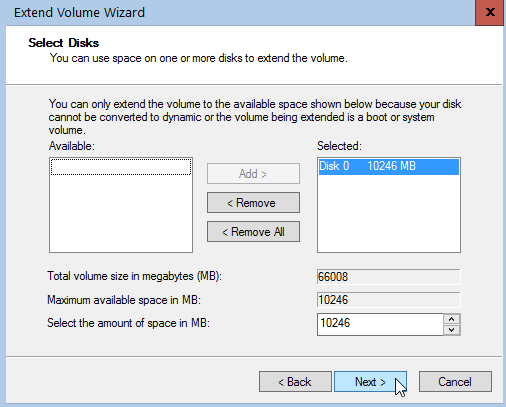
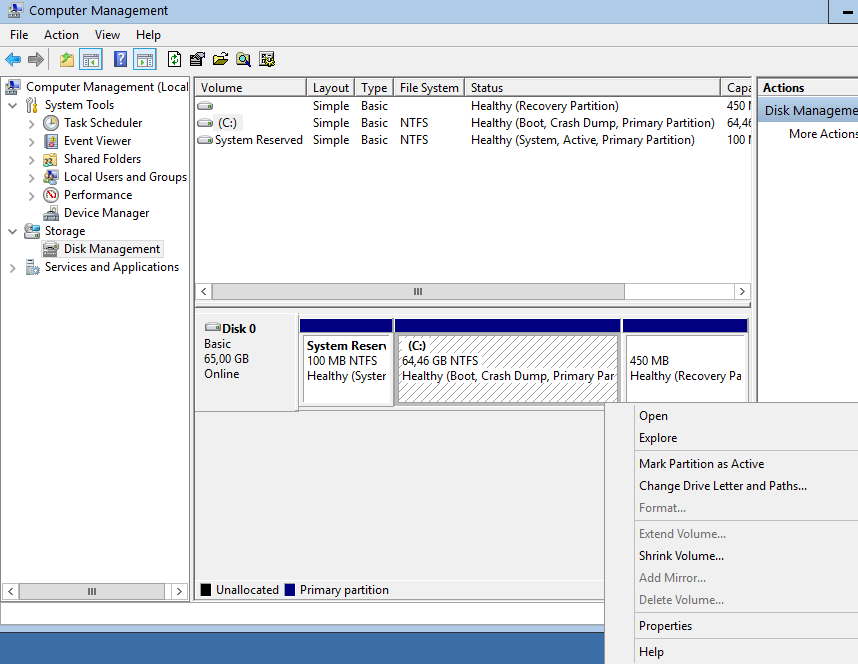
Computer Management - Disk Management
It’s time to extend our partition:
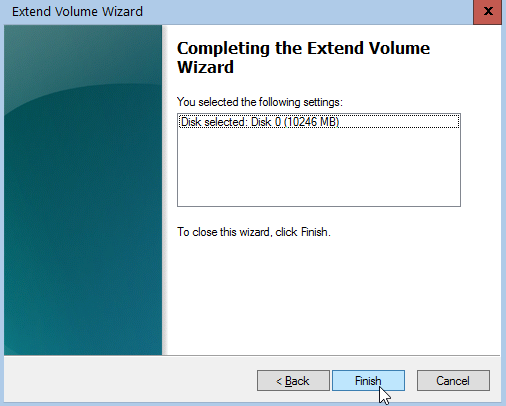
Finish
A Beginner’s Guide on How to use Thunderbird with Enigmail (Gpg4win) with their gmail account in 10 minutes on a windows machine
Thunderbird Enigmail - Gmail, Windows from vimeouser on Vimeo.
Linux Raid
This blog post is created as a mental note for future reference
Linux Raid is the de-facto way for decades in the linux-world on how to create and use a software raid. RAID stands for: Redundant Array of Independent Disks. Some people use the I for inexpensive disks, I guess that works too!
In simple terms, you can use a lot of hard disks to behave as one disk with special capabilities!
You can use your own inexpensive/independent hard disks as long as they have the same geometry and you can do almost everything. Also it’s pretty easy to learn and use linux raid. If you dont have the same geometry, then linux raid will use the smallest one from your disks. Modern methods, like LVM and BTRFS can provide an abstract layer with more capabilities to their users, but some times (or because something you have built a loooong time ago) you need to go back to basics.
And every time -EVERY time- I am searching online for all these cool commands that those cool kids are using. Cause what’s more exciting than replacing your -a decade ago- linux raid setup this typical Saturday night?
Identify your Hard Disks
% find /sys/devices/ -type f -name model -exec cat {} \;
ST1000DX001-1CM1
ST1000DX001-1CM1
ST1000DX001-1CM1

% lsblk
NAME   MAJ:MIN RM   SIZE RO TYPE  MOUNTPOINT
sda      8:0    0 931.5G  0 disk
sdb      8:16   0 931.5G  0 disk
sdc      8:32   0 931.5G  0 disk

% lsblk -io KNAME,TYPE,SIZE,MODEL

KNAME TYPE    SIZE MODEL
sda   disk  931.5G ST1000DX001-1CM1
sdb   disk  931.5G ST1000DX001-1CM1
sdc   disk  931.5G ST1000DX001-1CM1
Create a RAID-5 with 3 Disks
Having 3 hard disks of 1T size, we are going to use the raid-5 Level . That means that we have 2T of disk usage and the third disk with keep the parity of the first two disks. Raid5 provides us with the benefit of loosing one hard disk without loosing any data from our hard disk scheme.

% mdadm -C -v /dev/md0 --level=5 --raid-devices=3 /dev/sda /dev/sdb /dev/sdc

mdadm: layout defaults to left-symmetric
mdadm: layout defaults to left-symmetric
mdadm: chunk size defaults to 512K
mdadm: sze set to 5238784K
mdadm: Defaulting to version 1.2 metadata
md/raid:md0 raid level 5 active with 2 our of 3 devices, algorithm 2
mdadm: array /dev/md0 started.

% cat /proc/mdstat

Personalities : [raid6] [raid5] [raid4]
md0: active raid5 sdc[3] sdb[2] sda[1]
        10477568 blocks super 1.2 level 5, 512k chink, algorith 2 [3/3] [UUU]

unused devices: <none>
running lsblk will show us our new scheme:
# lsblk -io KNAME,TYPE,SIZE,MODEL
KNAME TYPE    SIZE MODEL
sda   disk  931.5G ST1000DX001-1CM1
md0   raid5   1.8T
sdb   disk  931.5G ST1000DX001-1CM1
md0   raid5   1.8T
sdc   disk  931.5G ST1000DX001-1CM1
md0   raid5   1.8T
Save the Linux Raid configuration into a file
Software linux raid means that the raid configuration is actually ON the hard disks. You can take those 3 disks and put them to another linux box and everything will be there!! If you are keeping your operating system to another harddisk, you can also change your linux distro from one to another and your data will be on your linux raid5 and you can access them without any extra software from your new linux distro.
But it is a good idea to keep the basic conf to a specific configuration file, so if you have hardware problems your machine could understand what type of linux raid level you need to have on those broken disks!
% mdadm --detail --scan >> /etc/mdadm.conf

% cat /etc/mdadm.conf
ARRAY /dev/md0 metadata=1.2 name=MyServer:0 UUID=ef5da4df:3e53572e:c3fe1191:925b24cf
UUID - Universally Unique IDentifier
Be very careful that the above UUID is the UUID of the linux raid on your disks.
We have not yet created a filesystem over this new disk /dev/md0 and if you need to add this filesystem under your fstab file you can not use the UUID of the linux raid md0 disk.
Below there is an example on my system:
% blkid
/dev/sda: UUID="ef5da4df-3e53-572e-c3fe-1191925b24cf" UUID_SUB="f4e1da17-e4ff-74f0-b1cf-6ec86eca3df1" LABEL="MyServer:0" TYPE="linux_raid_member"
/dev/sdb: UUID="ef5da4df-3e53-572e-c3fe-1191925b24cf" UUID_SUB="ad7315e5-56ce-bd8c-75c5-0a72893a63db" LABEL="MyServer:0" TYPE="linux_raid_member"
/dev/sdc: UUID="ef5da4df-3e53-572e-c3fe-1191925b24cf" UUID_SUB="a90e317e-4384-8f30-0de1-ee77f8912610" LABEL="MyServer:0" TYPE="linux_raid_member"

/dev/md0: LABEL="data" UUID="48fc963a-2128-4d35-85fb-b79e2546dce7" TYPE="ext4"

% cat /etc/fstab

UUID=48fc963a-2128-4d35-85fb-b79e2546dce7   /backup auto    defaults    0   0
Replacing a hard disk
Hard disks will fail you. This is a fact that every sysadmin knows from day one. Systems will fail at some point in the future. So be prepared and keep backups !!
Failing a disk
Now it’s time to fail (if not already) the disk we want to replace:
% mdadm --manage /dev/md0 --fail /dev/sdb
mdadm: set /dev/sdb faulty in /dev/md0
Remove a broken disk
Here is a simple way to remove a broken disk from your linux raid configuration. Remember with raid5 level we can manage with 2 hard disks.
% mdadm --manage /dev/md0 --remove /dev/sdb
mdadm: hot removed /dev/sdb from /dev/md0

% cat /proc/mdstat
Personalities : [raid6] [raid5] [raid4]
md0 : active raid5 sda[1] sdc[3]
      1953262592 blocks super 1.2 level 5, 512k chunk, algorithm 2 [3/2] [_UU]

unused devices: <none>
dmesg shows:
% dmesg | tail

md: data-check of RAID array md0
md: minimum _guaranteed_  speed: 1000 KB/sec/disk.
md: using maximum available idle IO bandwidth (but not more than 200000 KB/sec) for data-check.
md: using 128k window, over a total of 976631296k.
md: md0: data-check done.
md/raid:md0: Disk failure on sdb, disabling device.
md/raid:md0: Operation continuing on 2 devices.
RAID conf printout:
 --- level:5 rd:3 wd:2
 disk 0, o:0, dev:sda
 disk 1, o:1, dev:sdb
 disk 2, o:1, dev:sdc
RAID conf printout:
 --- level:5 rd:3 wd:2
 disk 0, o:0, dev:sda
 disk 2, o:1, dev:sdc
md: unbind<sdb>
md: export_rdev(sdb)
Adding a new disk - replacing a broken one
Now it’s time to add a new and (if possible) clean hard disk. Just to be sure, I always wipe with dd the first few kilobytes of every disk with zeros.
Using mdadm to add this new disk:
# mdadm --manage /dev/md0 --add /dev/sdb
mdadm: added /dev/sdb

% cat /proc/mdstat
Personalities : [raid6] [raid5] [raid4]
md0 : active raid5 sdb[4] sda[1] sdc[3]
      1953262592 blocks super 1.2 level 5, 512k chunk, algorithm 2 [3/2] [_UU]
      [>....................]  recovery =  0.2% (2753372/976631296) finish=189.9min speed=85436K/sec

unused devices: <none>
For a 1T Hard Disk is about 3h of recovering data. Keep that in mind on scheduling the maintenance window.
after a few minutes:
% cat /proc/mdstat
Personalities : [raid6] [raid5] [raid4]
md0 : active raid5 sdb[4] sda[1] sdc[3]
      1953262592 blocks super 1.2 level 5, 512k chunk, algorithm 2 [3/2] [_UU]
      [>....................]  recovery =  4.8% (47825800/976631296) finish=158.3min speed=97781K/sec

unused devices: <none>
mdadm shows:
% mdadm --detail /dev/md0

/dev/md0:
        Version : 1.2
  Creation Time : Wed Feb 26 21:00:17 2014
     Raid Level : raid5
     Array Size : 1953262592 (1862.78 GiB 2000.14 GB)
  Used Dev Size : 976631296 (931.39 GiB 1000.07 GB)
   Raid Devices : 3
  Total Devices : 3
    Persistence : Superblock is persistent

    Update Time : Mon Oct 17 21:52:05 2016
          State : clean, degraded, recovering
 Active Devices : 2
Working Devices : 3
 Failed Devices : 0
  Spare Devices : 1

         Layout : left-symmetric
     Chunk Size : 512K

 Rebuild Status : 58% complete

           Name : MyServer:0  (local to host MyServer)
           UUID : ef5da4df:3e53572e:c3fe1191:925b24cf
         Events : 554

    Number   Major   Minor   RaidDevice State
       1       8       16        1      active sync   /dev/sda
       4       8       32        0      spare rebuilding   /dev/sdb
       3       8       48        2      active sync   /dev/sdc
You can use watch command that refreshes every two seconds your terminal with the output :
# watch cat /proc/mdstat

Every 2.0s: cat /proc/mdstat                                                                                               Mon Oct 17 21:53:34 2016

Personalities : [raid6] [raid5] [raid4]
md0 : active raid5 sdb[4] sda[1] sdc[3]
      1953262592 blocks super 1.2 level 5, 512k chunk, algorithm 2 [3/2] [_UU]
      [===========>.........]  recovery = 59.4% (580918844/976631296) finish=69.2min speed=95229K/sec

unused devices: <none>
Growing a Linux Raid
Even so … 2T is not a lot of disk usage these days! If you need to grow-extend your linux raid, then you need hard disks with the same geometry (or larger).
Steps on growing your linux raid are also simply:
# Umount the linux raid device:
% umount /dev/md0

# Add the new disk
% mdadm --add /dev/md0 /dev/sdd

# Check mdstat
% cat /proc/mdstat

# Grow linux raid by one device
%  mdadm --grow /dev/md0 --raid-devices=4

# watch mdstat for reshaping to complete - also 3h+ something
% watch cat /proc/mdstat

# Filesystem check your linux raid device
% fsck -y /dev/md0

# Resize - Important
% resize2fs /dev/md0
But sometimes life happens …
Need 1 spare to avoid degraded array, and only have 0.
mdadm: Need 1 spare to avoid degraded array, and only have 0.
or
mdadm: Failed to initiate reshape!
Sometimes you get an error that informs you that you can not grow your linux raid device! It’s not time to panic or flee the scene. You’ve got this. You have already kept a recent backup before you started and you also reading this blog post!
You need a (an extra) backup-file !
% mdadm --grow --raid-devices=4 --backup-file=/tmp/backup.file /dev/md0
mdadm: Need to backup 3072K of critical section..

% cat /proc/mdstat
Personalities : [linear] [multipath] [raid0] [raid1] [raid6] [raid5] [raid4] [raid10]
md0 : active raid5 sda[4] sdb[0] sdd[3] sdc[1]
      1953262592 blocks super 1.2 level 5, 512k chunk, algorithm 2 [4/4] [UUUU]
      [>....................]  reshape =  0.0

% (66460/976631296) finish=1224.4min speed=13292K/sec

unused devices: <none>
1224.4min seems a lot !!!
dmesg shows:
% dmesg
[   36.477638] md: Autodetecting RAID arrays.
[   36.477649] md: Scanned 0 and added 0 devices.
[   36.477654] md: autorun ...
[   36.477658] md: ... autorun DONE.

[  602.987144] md: bind<sda>
[  603.219025] RAID conf printout:
[  603.219036]  --- level:5 rd:3 wd:3
[  603.219044]  disk 0, o:1, dev:sdb
[  603.219050]  disk 1, o:1, dev:sdc
[  603.219055]  disk 2, o:1, dev:sdd
[  608.650884] RAID conf printout:
[  608.650896]  --- level:5 rd:3 wd:3
[  608.650903]  disk 0, o:1, dev:sdb
[  608.650910]  disk 1, o:1, dev:sdc
[  608.650915]  disk 2, o:1, dev:sdd
[  684.308820] RAID conf printout:
[  684.308832]  --- level:5 rd:4 wd:4
[  684.308840]  disk 0, o:1, dev:sdb
[  684.308846]  disk 1, o:1, dev:sdc
[  684.308851]  disk 2, o:1, dev:sdd
[  684.308855]  disk 3, o:1, dev:sda
[  684.309079] md: reshape of RAID array md0
[  684.309089] md: minimum _guaranteed_  speed: 1000 KB/sec/disk.
[  684.309094] md: using maximum available idle IO bandwidth (but not more than 200000 KB/sec) for reshape.
[  684.309105] md: using 128k window, over a total of 976631296k.
mdstat
% cat /proc/mdstat
Personalities : [linear] [multipath] [raid0] [raid1] [raid6] [raid5] [raid4] [raid10]
md0 : active raid5 sda[4] sdb[0] sdd[3] sdc[1]
      1953262592 blocks super 1.2 level 5, 512k chunk, algorithm 2 [4/4] [UUUU]
      [>....................]  reshape =  0.0

% (349696/976631296) finish=697.9min speed=23313K/sec

unused devices: <none>
ok it’s now 670minutes
Time to use watch:
(after a while)
% watch cat /proc/mdstat

Personalities : [linear] [multipath] [raid0] [raid1] [raid6] [raid5] [raid4] [raid10]
md0 : active raid5 sda[4] sdb[0] sdd[3] sdc[1]
      1953262592 blocks super 1.2 level 5, 512k chunk, algorithm 2 [4/4] [UUUU]
      [===========>......]  reshape = 66.1% (646514752/976631296) finish=157.4min speed=60171K/sec

unused devices: <none>
mdadm shows:
% mdadm --detail /dev/md0

/dev/md0:
        Version : 1.2
  Creation Time : Thu Feb  6 13:06:34 2014
     Raid Level : raid5
     Array Size : 1953262592 (1862.78 GiB 2000.14 GB)
  Used Dev Size : 976631296 (931.39 GiB 1000.07 GB)
   Raid Devices : 4
  Total Devices : 4
    Persistence : Superblock is persistent

    Update Time : Sat Oct 22 14:59:33 2016
          State : clean, reshaping
 Active Devices : 4
Working Devices : 4
 Failed Devices : 0
  Spare Devices : 0

         Layout : left-symmetric
     Chunk Size : 512K

 Reshape Status : 66% complete
  Delta Devices : 1, (3->4)

           Name : MyServer:0
           UUID : d635095e:50457059:7e6ccdaf:7da91c9b
         Events : 1536

    Number   Major   Minor   RaidDevice State
       0       8       16        0      active sync   /dev/sdb
       1       8       32        1      active sync   /dev/sdc
       3       8       48        2      active sync   /dev/sdd
       4       8        0        3      active sync   /dev/sda
be patient and keep an aye on mdstat under proc.
So basically those are the steps, hopefuly you will find them useful.
# /bin/find /sys/devices -type f -name model -exec cat {} \;

KINGSTON SV300S3
WDC WD10EURX-63F
WDC WD10EZRX-00A
VB0250EAVER
VB0250EAVER

# udisksctl status

MODEL                     REVISION  SERIAL               DEVICE
--------------------------------------------------------------------------
KINGSTON SV300S37A120G    527ABBF0  50026B774902D7E5     sda
WDC WD10EURX-63FH1Y0      01.01A01  WD-WMC1U5525831      sdb
WDC WD10EZRX-00A8LB0      01.01A01  WD-WCC1U2715714      sdc
VB0250EAVER               HPG9      Z3TLRVYK             sdd
VB0250EAVER               HPG9      Z3TLRRKM             sde

# lsblk -io KNAME,TYPE,SIZE,MODEL

KNAME TYPE    SIZE MODEL
sda   disk  111,8G KINGSTON SV300S3
sdb   disk  931,5G WDC WD10EURX-63F
sdc   disk  931,5G WDC WD10EZRX-00A
sdd   disk  232,9G VB0250EAVER
sde   disk  232,9G VB0250EAVER
also
# smartctl -a -i /dev/sda

# hdparm -i /dev/sda

# lshw -class disk

# hwinfo --disk
Most people -reading this blog post- will scream in their chairs … PLZ keep in-mind that I am not a developer and perhaps the below workaround is just that, a workaround.
I have this case that I need to render (with JS) text that already has passed through the PHP parser.
The caveat is that the text output is inside a <DIV> element and has HTML code in it.
Most of you understand that HTML inside a DIV element is not something useful as the browser’s engine is rendering it to HTML on page load. That means, that we can not get the innerHTML of this DIV element, as it is already rendered by the browser.
Let me give you an example:
<div>

<!DOCTYPE html>
<html>
  <body>
      <p align="center">
        <div> An Example </div>
      </p>
  </body>
</html>

</div>
If you open a test.html page with the above code, and fire up any browser, you will see only: An Example as the output of the above DIV. There is no way to get the HTML code from the above example.
You probably thinking that I need to edit the PHP parser. Actually this DIV element is been filled up with an Ajax request from the PHP API, so no luck on the server-side code.
After spending a brutal weekend with http://www.w3schools.com and reading through every stackoverflow question, nothing appeared to get me closer to my purpose.
I’ve tried jquery with .html(), .text(), getting the innerHTML, I’ve tried everything I could think of. The only way to get the HTML code from inside an HTML DOM element is if the HTML code was/is inside a TEXT element, somehow.
I needed to get a TEXT element instead of a DIV element, so that I could get the text value of the HTML element.
So here is my workaround:
I encapsulated a hidden textarea HTML element inside the DIV !
<div class="show_myclass">
<textarea class="myclass" style="display:none;">

<!DOCTYPE html>
<html>
  <body>
      <p align="center">
        <div> An Example </div>
      </p>
  </body>
</html>

</ textarea>
</ div>
I can now, get the text value of the textarea and use it.
My JS code became something like this:
1.    $(".myclass").each(function(i, block ) {
2.        document.getElementsByClassName("show_myclass")[i].innerHTML = my_function_that_does_magic( block.value );
3.    });
Let me explain a few things … for people that are nοt so much familiar with jquery or JS (like me).
Line 1: Α jquery selector by class, exactly like this getElementsByClassName() in HTML DOM but it is an iterator already with each function. For every element with classname = myclass do something. In a page with multiple DIVs-TextAreas this will be very useful.
Line 2: Get the TEXT value from the textarea ( block.value ) and run it as argument thought our magic function. Then populate the HTML result on the DIV element with the same iterator.
In conclusion, when the browser finally renders the whole page, the above javascript code will override the DIV element and will instead of -not- showing the hidden textarea, will show the output of our my_function_that_does_magic function !!!

I really like this comic.
I try to read/learn something every day.
Sometimes, when I find an interesting article, I like to mark it for reading it later.
I use many forms of marking, like pin tabs, bookmarking, sending url via email, save the html page to a folder, save it to my wallabag instance, leave my browser open to this tab, send the URL QR to my phone etc etc etc.
Are all the above ways productive?
None … the time to read something is now!
I mean the first time you lay your eyes upon the article.
Not later, not when you have free time, now.
That’s the way it works with me. Perhaps with you something else is more productive.
I have a short attention span and it is better for me to drop everything and read something carefully that save it for later or some other time.
When I really have to save it for later, my preferable way is to save it to my wallabag instance. It’s perfect and you will love it.
I also have a kobo ebook (e-ink) reader. Not the android based.
From my wallabag I can save them to epub and export them to my kobo.
But I am lazy and I never do it.
My kobo reader has a pocket (getpocket) account.
So I’ve tried to save some articles but not always pocket can parse properly the content of an article. Not even wallabag always work 100%.
The superiority of wallabag (and self-hosted application) is that when a parsing problem occurs I can fix them! Open a git push request and then EVERYBODY in the community will be able to read-this article from this content provider-later. I cant do something like that with pocket or readability.
And then … there are ads !!! Lots of ads, Tons of ads !!!
There is a correct way to do ads and this is when you are not covering the article you want people to read!
The are a lot of wrong ways to do ads: inline the text, above the article, hiding some of the content, make people buy a fee, provide an article to small pages (you know that height in HTML is not a problem, right?) and then there is bandwidth issues.
When I am on my mobile, I DONT want to pay extra for bandwidth I DIDNT ask and certainly do not care about it!!!
If I read the article on my tiny mobile display DO NOT COVER the article with huge ads that I can not find the X-close button because it doesnt fit to my display !!!
So yes, there is a correct way to do ads and that is by respecting the reader and there is a wrong way to do ads.
Getting back to the article’s subject, below you will see six (6) ways to read an article on my desktop. Of course there are hundreds ways but there are the most common ones:
Article: The cyberpunk dystopia we were warned about is already here
https://versions.killscreen.com/cyberpunk-dystopia-warned-already/
Extra info:
windows width: 852
2 times zoom-out to view more text
- Original Post in Firefox 48.0.1
- Wallabag
- Reader View in Firefox
- Chromium 52.0.2743.116
- Midori 0.5.11 - WebKitGTK+ 2.4.11
Click to zoom:

I believe that Reader View in Firefox is the winner of this test. It is clean and it is focusing on the actual article.
Impressive !
I have a compressed file of:
250.000.000 lines
Compressed the file size is: 671M
Uncompressed, it's: 6,5G
Need to extract a plethora of things and verify some others.
I dont want to use bash but something more elegant, like python or lua.
Looking through “The-Internet”, I’ve created some examples for the single purpose of educating my self.
So here are my results.
BE AWARE they are far-far-far away from perfect in code or execution.
Sorted by (less) time of execution:
pigz
# time pigz  -p4 -cd  2016-08-04-06.ldif.gz &> /dev/null

real    0m9.980s
user    0m16.570s
sys 0m0.980s
gzip
gzip 1.8
# time /bin/gzip -cd 2016-08-04-06.ldif.gz &> /dev/null

real    0m23.951s
user    0m23.790s
sys 0m0.150s
zcat
zcat (gzip) 1.8
# time zcat 2016-08-04-06.ldif.gz &> /dev/null

real    0m24.202s
user    0m24.100s
sys 0m0.090s
Perl
Perl v5.24.0
code:
#!/usr/bin/perl

open (FILE, '/bin/gzip -cd 2016-08-04-06.ldif.gz |');

while (my $line = ) {
  print $line;
}

close FILE;
time:
# time ./dump.pl &> /dev/null

real    0m49.942s
user    1m14.260s
sys 0m2.350s
PHP
PHP 7.0.9 (cli)
code:
#!/usr/bin/php

< ? php

  $fp = gzopen("2016-08-04-06.ldif.gz", "r");

  while (($buffer = fgets($fp, 4096)) !== false) {
        echo $buffer;
  }

  gzclose($fp);

 ? >
time:
# time php -f dump.php &> /dev/null

real    1m19.407s
user    1m4.840s
sys 0m14.340s
PHP - Iteration #2
PHP 7.0.9 (cli)
Impressed with php results, I took the perl-approach on code:
< ? php

  $fp = popen("/bin/gzip -cd 2016-08-04-06.ldif.gz", "r");

  while (($buffer = fgets($fp, 4096)) !== false) {
        echo $buffer;
  }

  pclose($fp);

 ? >
time:
# time php -f dump2.php &> /dev/null

real    1m6.845s
user    1m15.590s
sys 0m19.940s
not bad !
Lua
Lua 5.3.3
code:
#!/usr/bin/lua

local gzip = require 'gzip'

local filename = "2016-08-04-06.ldif.gz"

for l in gzip.lines(filename) do
  print(l)
end
time:
# time ./dump.lua &> /dev/null

real    3m50.899s
user    3m35.080s
sys 0m15.780s
Lua - Iteration #2
Lua 5.3.3
I was depressed to see that php is faster than lua!!
Depressed I say !
So here is my next iteration on lua:
code:
#!/usr/bin/lua

local file = assert(io.popen('/bin/gzip -cd 2016-08-04-06.ldif.gz', 'r'))

while true do
        line = file:read()
        if line == nil then break end
        print (line)
end
file:close()
time:
# time ./dump2.lua &> /dev/null

real    2m45.908s
user    2m54.470s
sys 0m21.360s
One minute faster than before, but still too slow !!
Lua - Zlib
Lua 5.3.3
My next iteration with lua is using zlib :
code:
#!/usr/bin/lua

local zlib = require 'zlib'
local filename = "2016-08-04-06.ldif.gz"

local block = 64
local d = zlib.inflate()

local file = assert(io.open(filename, "rb"))
while true do
  bytes = file:read(block)
  if not bytes then break end
  print (d(bytes))
end

file:close()
time:
# time ./dump.lua  &> /dev/null

real    0m41.546s
user    0m40.460s
sys 0m1.080s
Now, that's what I am talking about !!!
Playing with window_size (block) can make your code faster or slower.
Python v3
Python 3.5.2
code:
#!/usr/bin/python

import gzip

filename='2016-08-04-06.ldif.gz'
with gzip.open(filename, 'r') as f:
    for line in f:
        print(line,)
time:
# time ./dump.py &> /dev/null

real    13m14.460s
user    13m13.440s
sys 0m0.670s
Not enough tissues on the whole damn world!
Python v3 - Iteration #2
Python 3.5.2
but wait ... a moment ... The default mode for gzip.open is 'rb'.
(read binary)
let's try this once more with rt(read-text) mode:
code:
#!/usr/bin/python

import gzip

filename='2016-08-04-06.ldif.gz'
with gzip.open(filename, 'rt') as f:
    for line in f:
        print(line, end="")
time:
# time ./dump.py &> /dev/null

real    5m33.098s
user    5m32.610s
sys 0m0.410s
With only one super tiny change and run time in half!!!
But still tooo slow.
Python v3 - Iteration #3
Python 3.5.2
Let's try a third iteration with popen this time.
code:
#!/usr/bin/python

import os

cmd = "/bin/gzip -cd 2016-08-04-06.ldif.gz"
f = os.popen(cmd)
for line in f:
  print(line, end="")
f.close()
time:
# time ./dump2.py &> /dev/null

real    6m45.646s
user    7m13.280s
sys 0m6.470s
Python v3 - zlib Iteration #1
Python 3.5.2
Let's try a zlib iteration this time.
code:
#!/usr/bin/python

import zlib

d = zlib.decompressobj(zlib.MAX_WBITS | 16)
filename='2016-08-04-06.ldif.gz'

with open(filename, 'rb') as f:
    for line in f:
        print(d.decompress(line))
time:
# time ./dump.zlib.py &> /dev/null

real    1m4.389s
user    1m3.440s
sys 0m0.410s
finally some proper values with python !!!
Specs
All the running tests occurred to this machine:
4 x Intel(R) Core(TM) i3-3220 CPU @ 3.30GHz
8G RAM
Conclusions
Ok, I Know !
The shell-pipe approach of using gzip for opening the compressed file, is not fair to all the above code snippets.
But ... who cares ?
I need something that run fast as hell and does smart things on those data.
Get in touch
As I am not a developer, I know that you people know how to do these things even better!
So I would love to hear any suggestions or even criticism on the above examples.
I will update/report everything that will pass the "I think I know what this code do" rule and ... be gently with me ;)
PLZ use my email address: evaggelos [ _at_ ] balaskas [ _dot_ ] gr
to send me any suggestions
Thanks !
[Last uptime 2020-12-25]
I need to run some ansible playbooks to a running (live) machine.
But, of-course, I cant use a production server for testing purposes !!
So here comes docker!
I have ssh access from my docker-server to this production server:
ssh livebox tar --one-file-system --sparse -C / -cf - | docker import - centos6:livebox on ubuntu 20.04
ssh livebox sudo tar -cf - --sparse --one-file-system / | docker import - centos6:livebox
Then run the new docker image:
$  docker run -t -i --rm -p 2222:22 centos6:livebox bash

[root@40b2bab2f306 /]# /usr/sbin/sshd -D
Create a new entry on your hosts inventory file, that uses ssh port 2222
or create a new separated inventory file
and test it with ansible ping module:
# ansible -m ping -i hosts.docker dockerlivebox

dockerlivebox | success >> {
    "changed": false,
    "ping": "pong"
}
Fatal error: Call to undefined function imagecreatefromjpeg() in /var/www/html/fp-plugins/thumb/plugin.thumb.php on line 77