Introduction
If you work with Docker long enough, you stop having one Docker environment.
- You have your local laptop.
- You have a remote VM or homelab server.
- You might have a staging host, a production host, or a CI runner somewhere in the cloud.
And sooner or later, you start asking yourself:
“Wait… where am I running this container?”
Docker contexts exist to solve exactly this problem—cleanly, safely, and without shell hacks.
This blog post explains what Docker contexts are, how they work in practice, and how to use them effectively based on real-world usage.
What Is a Docker Context?
At a practical level, a Docker context is:
- A named configuration
- That defines how the Docker CLI connects to a Docker Engine
- And optionally includes credentials and TLS/SSH details
When you run any Docker command, the CLI:
- Resolves the active context
- Reads its endpoint configuration
- Talks to the corresponding Docker Engine
What a Context Contains (Practically)
A context can define:
- Local Unix socket (
/var/run/docker.sock) - Remote Docker over SSH
- Remote Docker over TCP + TLS
- Cloud-managed Docker endpoints
Internally, contexts are stored under:
~/.docker/contexts/You almost never need to touch this manually—and that’s a good thing.
Practical Example: Local Laptop → Remote Docker Host over SSH
From your home PC, you want to manage Docker running on a remote machine called remote-vps.
Disclaimer: You need to have an ssh connection already set in ~/.ssh/config or via tailscale
Creating a Context
docker context create remote-vps --docker "host=ssh://remote-vps"That’s it.
No SSH tunnel scripts.
No DOCKER_HOST exports.
No wrapper functions.
Listing Contexts
docker context lsOutput (trimmed):
NAME         DESCRIPTION                               DOCKER ENDPOINT
default   *  Current DOCKER_HOST based configuration   unix:///var/run/docker.sock
remote-vps                                             ssh://remote-vps
The * indicates the currently active context.
Switching Contexts
docker context use remote-vpsFrom this point on, every Docker command runs against the Docker Engine on remote-vps.
This includes:
docker psdocker imagesdocker statsdocker compose
No mental gymnastics required.
Real-World Usage: Observing a Remote Host
Once the context is active, normal commands “just work” out of the box.
Containers and Images
docker ps     -a
docker images -a
or even compose
❯ docker compose ls
NAME                STATUS              CONFIG FILES
traefik             running(9)          /opt/services/traefik/docker-compose.yml
You are now inspecting the remote host—not your laptop.
Live Resource Usage
docker stats --no-streamExample output:
NAME          CPU %     MEM USAGE / LIMIT
wiki          0.01%     14.16MiB / 3.825GiB
mariadb       0.10%     83.74MiB / 3.825GiB
traefik       0.00%     42.62MiB / 3.825GiB
This is extremely useful when:
- You want quick visibility without SSHing in
- You’re comparing resource usage across environments
- You’re debugging “why is this host slow?”
Example: Deploying a Service via Docker Compose
With the remote-vps context active, you can deploy services remotely using Compose as if they were local.
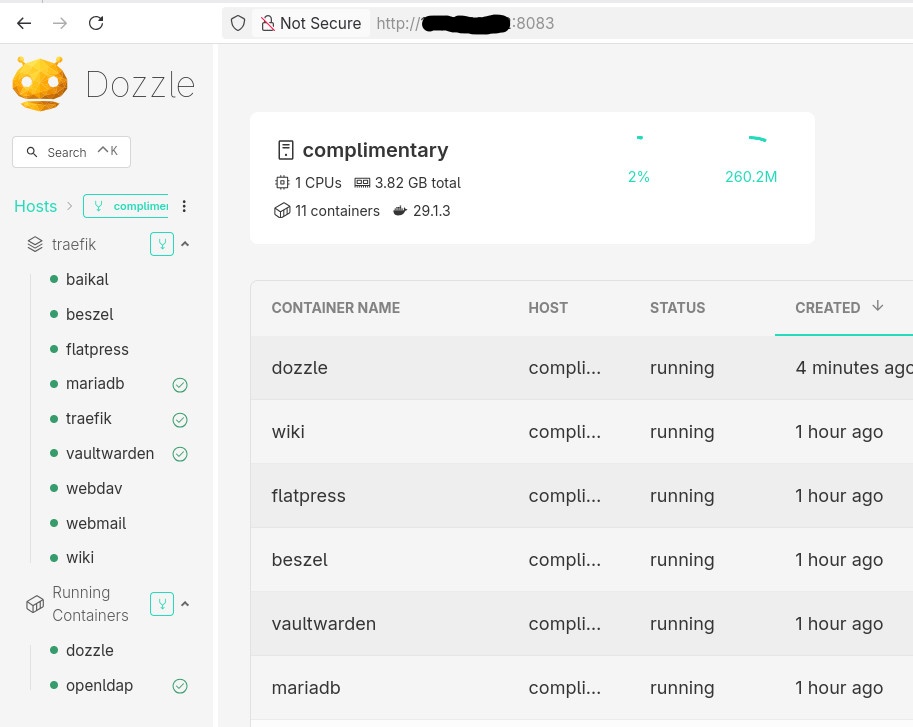
Example: running Dozzle (Docker log viewer).
docker-compose.yaml
services:
  dozzle:
    image: amir20/dozzle:latest
    container_name: dozzle
    hostname: dozzle
    volumes:
      - /var/run/docker.sock:/var/run/docker.sock
    ports:
      - 8083:8080
Be Aware: I’ve changed the port to 8083 for this example.
Deploying
docker compose -v upThe image is pulled on the remote host, the container runs on the remote host, and port 8083 is exposed there.
No SCP.
No SSH shell.
No surprises.
Common Mistake
- Forgetting the Active Context !
This is the most common mistake.
Run this often:
docker context lsBetter yet: configure your shell prompt to show the active context.
Best Practices from Real Usage
- Use one context per environment (local, staging, prod)
- Name contexts clearly (
prod-eu,homelab,ci-runner) - Avoid running destructive commands without checking context
- Treat contexts as infrastructure, not convenience hacks
- Combine with read-only SSH users for production when possible
That’s it !
- Evaggelos Balaskas
Prologue – Why do this at all?
Running services at home is fun. Running them securely and reliably is where things get interesting.
In my homelab, I run many applications, like Immich on a legacy PC, behind a residential ISP connection, dynamic IPs, and without opening ports on my router. This setup provides my test lab and a way to play and learn without the use of any cloud. At the same time, I want to use some of my internal services from the internet as securely as I can.
This post describes how to achieve exactly that using:
- Tailscale as a secure private network between hosts
- DNS-01 Let’s Encrypt challenges for automated TLS
- A remote homelab service (Immich) reachable only over Tailscale
Important: The DNS record must exist before Traefik requests certificates.
High-level architecture
Before diving into configs, let’s clarify the flow:
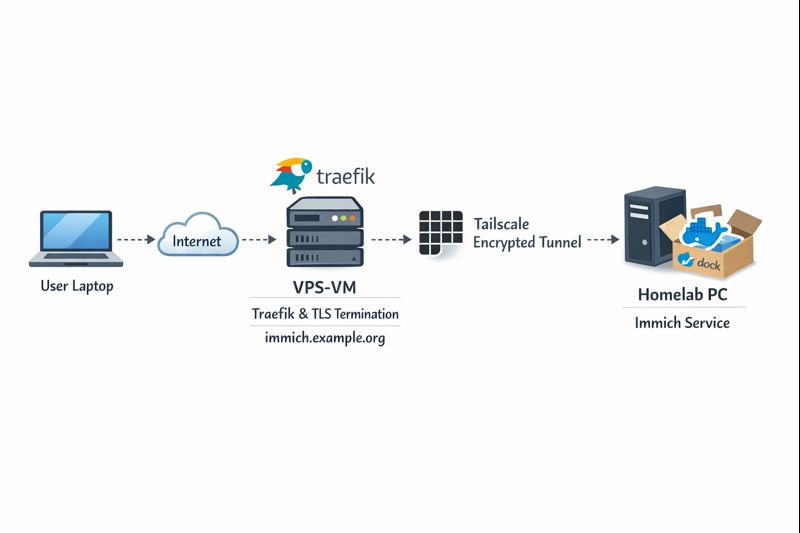
Key points:
- DNS entry (eg. immich.example.org) exists before Traefik starts, enabling ACME issuance
- Traefik as an internet-facing reverse proxy - Only Traefik is exposed to the internet
- Immich listens on a private Tailscale IP (100.x.x.x)
- Valid TLS certificates from Let’s Encrypt - TLS is terminated at Traefik
- No inbound firewall rules on my home network - No port forwarding on the home router
- Minimal attack surface
- Clean separation between edge and internal services
Why not expose Immich directly?
Opening ports on a home router comes with downsides:
- Public IP changes
- Consumer-grade firewalling
- Direct exposure of application vulnerabilities
- Harder TLS automation
This setup avoids all of that.
Why Tailscale?
Tailscale gives you:
- WireGuard-based encryption by default
- Stable private IPs
- Mutual authentication
- No inbound NAT rules
- Fine-grained ACLs (optional, but recommended)
Even if Traefik were compromised, the blast radius is limited to what it can access over Tailscale.
Why DNS-01 instead of HTTP-01?
DNS-01 lets Traefik:
- Obtain certificates without the backend being reachable
- Issue certs before the service is live
- Avoid exposing port 80 on internal services
This is especially useful when the backend is private or remote.
Prerequisites
Before starting, make sure you have:
- A domain name (e.g.
example.org) - A DNS provider supported by Traefik (LuaDNS in this case)
- A public server (VPS, cloud VM) for Traefik
-
Tailscale installed on:
- The Traefik host
- Your homelab / home PC
-
A DNS record:
immich.example.org → <Traefik public IP>
Important: The DNS record must exist before Traefik requests certificates.
Traefik setup (edge host)
Docker Compose
Traefik runs as a standalone service on the edge host:
---
services:
  traefik:
    image: traefik:v3.6
    container_name: traefik
    hostname: traefik
    env_file:
      - ./.env
    environment:
      - TRAEFIK_CERTIFICATESRESOLVERS_LETSENCRYPT_ACME_EMAIL=${LUADNS_API_USERNAME}
    restart: unless-stopped
    ports:
      - 8080:8080 # Dashboard (secured, no insecure mode)
      - 80:80     # HTTP
      - 443:443   # HTTPS
    volumes:
      - ./certs:/certs             # For static certificates
      - ./etc_traefik:/etc/traefik # Traefik configuration files
      - /var/run/docker.sock:/var/run/docker.sock:ro  # So that Traefik can listen to the Docker events
    healthcheck:
      test: ["CMD", "traefik", "healthcheck"]
      interval: 30s
      retries: 3
      timeout: 10s
      start_period: 10s
Static Traefik configuration (traefik.yml)
This file defines entrypoints, providers, logging, and ACME:
ping: {}

api:
  dashboard: true
  insecure: false

log:
  filePath: /etc/traefik/traefik.log
  level: INFO

entryPoints:
  web:
    address: ":80"
    reusePort: true
  websecure:
    address: ":443"
    reusePort: true

providers:
  docker:
    exposedByDefault: false
  file:
    directory: /etc/traefik/dynamic/
    watch: true
We explicitly disable auto-exposure of Docker containers and rely on file-based dynamic config to have more control on which docker services we want traefik to “see”.
Let’s Encrypt via DNS-01 (LuaDNS)
certificatesResolvers:
  letsencrypt:
    acme:
      email: ""
      storage: "/certs/acme.json"
      caServer: https://acme-v02.api.letsencrypt.org/directory
      dnsChallenge:
        provider: luadns
        delayBeforeCheck: 0
        resolvers:
          - "8.8.8.8:53"
          - "1.1.1.1:53"
Why this matters:
- Certificates can be issued even if Immich is offline
- No need for port 80 reachability
- Works cleanly with private backends
Dynamic routing to Immich over Tailscale
This is where the magic happens.
Dynamic config (dynamic/immich.yml)
http:
  routers:
    immich:
      rule: 'Host(`immich.example.org`)'
      entryPoints: ["websecure"]
      service: "immich"
      tls:
        certResolver: letsencrypt

  services:
    immich:
      loadBalancer:
        servers:
          - url: "http://100.80.90.101:2283"
        passHostHeader: true
Explanation:
Host()rule matches your public domain- TLS is terminated at Traefik
- Backend URL is a Tailscale IP
- No exposure of Immich to the public internet
Homelab: Immich setup
On the home PC, Immich runs normally, bound to a local port:
ports:
  - '2283:2283'
Make sure to use the docker-compose.yml of the current release:
This port does not need to be:
- Exposed to the internet
- Forwarded on your router
- Secured with TLS
It only needs to be reachable from the Traefik host via Tailscale.
Verifying the setup
Visit: https://immich.example.org
You should get a valid Let’s Encrypt certificate and a working Immich UI.

Hardening ideas (recommended)
Once this works, consider:
- Tailscale ACLs limiting Traefik → Immich access
- Middleware for:
- Security headers
- Rate limiting
- IP allowlists
- Traefik dashboard behind auth
- Separate internal / external entrypoints
That's it !
🎉 If you want a self‑contained, production‑ready reverse proxy that automatically provisions TLS certificates from Let’s Encrypt and uses LuaDNS as the DNS provider, you’re in the right place.
Below you’ll find a step‑by‑step guide that walks through:
- Installing the required containers
- Configuring Traefik with LuaDNS DNS‑Challenge
- Running the stack and verifying everything works
TL;DR – Copy the files, set your environment variables, run
docker compose up -d, and point a browser tohttps://<your‑hostname>.
📁 Project Layout
traefik/
├── certs/                # ACME certificates will be stored here
├── docker-compose.yml    # Docker‑Compose definition
├── .env                  # Environment variables for the stack
└── etc_traefik/
    └── traefik.yml       # Traefik configuration
    └── dynamic/          # Dynamic Traefik configuration will be stored here
        └── whoami.yml    # WhoAmI configuration
Why this structure?
certs/– keeps the ACME JSON file outside the container so it survives restarts.etc_traefik/– keeps the Traefik config in a dedicated folder for clarity..env– central place to store secrets and other runtime values.
🔧 Step 1 – Prepare Your Environment
1. Install Docker & Docker‑Compose
If you don’t already have them:
# Debian/Ubuntu
sudo apt update && sudo apt install docker.io docker-compose-plugin

# Verify
docker --version
docker compose version
2. Clone or Create the Project Folder
mkdir -p traefik/certs traefik/etc_traefik/dynamic
cd traefik
⚙️ Step 2 – Create the Configuration Files
1. docker-compose.yml
services:
  traefik:
    image: traefik:v3.5
    container_name: traefik
    hostname: traefik

    env_file:
      - ./.env
    environment:
      - TRAEFIK_CERTIFICATESRESOLVERS_LETSENCRYPT_ACME_EMAIL=${LUADNS_API_USERNAME}

    restart: unless-stopped

    # Expose HTTP, HTTPS and the dashboard
    ports:
      - "8080:8080"  # Dashboard (insecure)
      - "80:80"
      - "443:443"

    volumes:
      - ./certs:/certs
      - ./etc_traefik:/etc/traefik
      - /var/run/docker.sock:/var/run/docker.sock:ro

    healthcheck:
      test: ["CMD", "traefik", "healthcheck"]
      interval: 30s
      retries: 3
      timeout: 10s
      start_period: 10s

  whoami:
    image: traefik/whoami
    container_name: whoami
    hostname: whoami
    depends_on:
      traefik:
        condition: service_healthy

    labels:
      - "traefik.enable=true"
Why
whoami?
It’s a simple container that prints the request metadata. Perfect for testing TLS, routing and DNS‑Challenge.
2. .env
UMASK="002"
TZ="Europe/Athens"

# LuaDNS credentials (replace with your own)
LUADNS_API_TOKEN="<Your LuaDNS API key>"
LUADNS_API_USERNAME="<Your Email Address>"

# Hostname you want to expose
MYHOSTNAME=whoami.example.org

# (Optional) LibreDNS server used for challenge verification
DNS="88.198.92.222"
Important – Do not commit your
.envto version control.
Use a.gitignoreentry or environment‑variable injection on your host.
3. etc_traefik/traefik.yml
# Ping endpoint for health checks
ping: {}

# Dashboard & API
api:
  dashboard: true
  insecure: true   # `true` only for dev; enable auth in prod

# Logging
log:
  filePath: /etc/traefik/traefik.log
  level: DEBUG

# Entry points (HTTP & HTTPS)
entryPoints:
  web:
    address: ":80"
    reusePort: true
  websecure:
    address: ":443"
    reusePort: true

# Docker provider – disable auto‑exposure
providers:
  docker:
    exposedByDefault: false

    # Enable file provider
    file:
        directory: /etc/traefik/dynamic/
        watch: true

# ACME resolver using LuaDNS
certificatesResolvers:
  letsencrypt:
    acme:
      # Will read from TRAEFIK_CERTIFICATESRESOLVERS_LETSENCRYPT_ACME_EMAIL
      # Or your add your email address directly !
      email: ""
      storage: "/certs/acme.json"
      # Uncomment the following line for production
      ## caServer: https://acme-v02.api.letsencrypt.org/directory
      # Staging environment (for testing only)
      caServer: https://acme-staging-v02.api.letsencrypt.org/directory
      dnsChallenge:
        provider: luadns
        delayBeforeCheck: 0
        resolvers:
          - "8.8.8.8:53"
          - "1.1.1.1:53"
Key points
storagepoints to the sharedcerts/folder.- We’re using the staging Let’s Encrypt server – change it to production when you’re ready.
dnsChallenge.provideris set toluadns; Traefik will automatically look for a LuaDNS plugin.
4. etc_traefik/dynamic/whoami.yml
http:
  routers:
    whoami:
      rule: 'Host(`{{ env "MYHOSTNAME" }}`)'
      entryPoints: ["websecure"]
      service: "whoami"
      tls:
        certResolver: letsencrypt
  services:
    whoami:
      loadBalancer:
        servers:
          - url: "http://whoami:80"
🔐 Step 3 – Run the Stack
docker compose up -dDocker will:
- Pull
traefik:v3.5andtraefik/whoami. - Create the containers, mount volumes, and start Traefik.
- Trigger a DNS‑Challenge for
whoami.example.org(via LuaDNS). - Request an ACME certificate from Let’s Encrypt.
Tip – Use
docker compose logs -f traefikto watch the ACME process in real time.
🚀 Step 4 – Verify Everything Works
-
Open a browser and go to https://whoami.example.org
(replace with whatever you set inMYHOSTNAME). -
You should see a JSON response similar to:
Hostname: whoami
IP: 127.0.0.1
IP: ::1
IP: 172.19.0.3
RemoteAddr: 172.19.0.2:54856
GET / HTTP/1.1
Host: whoami.example.org
User-Agent: Mozilla/5.0 (Macintosh; Intel Mac OS X 10_15_7) AppleWebKit/537.36 (KHTML, like Gecko) Chrome/141.0.0.0 Safari/537.36
Accept: text/html,application/xhtml+xml,application/xml;q=0.9,image/avif,image/webp,image/apng,*/*;q=0.8
Accept-Encoding: gzip, deflate, br, zstd
Accept-Language: en-GB,en;q=0.6
Cache-Control: max-age=0
Priority: u=0, i
Sec-Ch-Ua: "Brave";v="141", "Not?A_Brand";v="8", "Chromium";v="141"
Sec-Ch-Ua-Mobile: ?0
Sec-Ch-Ua-Platform: "macOS"
Sec-Fetch-Dest: document
Sec-Fetch-Mode: navigate
Sec-Fetch-Site: none
Sec-Fetch-User: ?1
Sec-Gpc: 1
Upgrade-Insecure-Requests: 1
X-Forwarded-For: 602.13.13.18
X-Forwarded-Host: whoami.example.org
X-Forwarded-Port: 443
X-Forwarded-Proto: https
X-Forwarded-Server: traefik
X-Real-Ip: 602.13.13.18
-
In the browser’s developer tools → Security tab, confirm the certificate is issued by Let’s Encrypt and that it is valid.
-
Inspect the Traefik dashboard at http://localhost:8080 (you’ll see the
whoamirouter and its TLS configuration).
🎯 What’s Next?
| Feature | How to enable |
|---|---|
| HTTPS‑only | Add - "traefik.http.middlewares.redirectscheme.scheme=https" to the router and use it as a middlewares label. |
| Auth on dashboard | Use Traefik’s built‑in auth middlewares or an external provider. |
| Automatic renewal | Traefik handles it automatically; just keep the stack running. |
| Production CA | Switch caServer to the production URL in traefik.yml. |
by making the change here:
      # Uncomment the following line for production
      caServer: https://acme-v02.api.letsencrypt.org/directory
      ## caServer: https://acme-staging-v02.api.letsencrypt.org/directory
Final Thoughts
Using Traefik with LuaDNS gives you:
- Zero‑configuration TLS that renews automatically.
- Fast DNS challenges thanks to LuaDNS’s low‑latency API.
- Docker integration – just add labels to any container and it’s instantly exposed.
Happy routing! 🚀
That’s it !
PS. These are my personal notes from my home lab; AI was used to structure and format the final version of this blog post.
Original Post is here:
https://blog.balaskas.gr/2025/10/10/setting-up-traefik-and-lets-encrypt-acme-with-luadns-in-docker/
🚀 Curious about trying out a Large Language Model (LLM) like Mistral directly on your own macbook?
Here’s a simple step-by-step guide I used on my MacBook M1 Pro. No advanced technical skills required, but some techinal command-line skills are needed. Just follow the commands and you’ll be chatting with an AI model in no time.
🧰 What We’ll Need
- LLM: A CLI utility and Python library for interacting with Large Language Models → a command-line tool and Python library that makes it easy to install and run language models.
- Mistral → a modern open-source language model you can run locally.
- Python virtual environment → a safe “sandbox” where we install the tools without messing with the rest of the system.
- MacBook → All Apple Silicon MacBooks (M1, M2, M3, M4 chips) feature an integrated GPU on the same chip as the CPU.
🧑🔬 About Mistral 7B
Mistral 7B is a 7-billion parameter large language model, trained to be fast, efficient, and good at following instructions.
Technical requirements (approximate):
- Full precision model (FP16) → ~13–14 GB of RAM (fits best on a server or high-end GPU).
- Quantized model (4-bit, like the one we use here) → ~4 GB of RAM, which makes it practical for a MacBook or laptop.
- Disk storage → the 4-bit model download is around 4–5 GB.
- CPU/GPU → runs on Apple Silicon (M1/M2/M3) CPUs and GPUs thanks to the MLX library. It can also run on Intel Macs, though it may be slower.
👉 In short:
With the 4-bit quantized version, you can run Mistral smoothly on a modern MacBook with 8 GB RAM or more. The more memory and cores you have, the faster it runs.
⚙️ Step 1: Create a Virtual Environment
We’ll create a clean workspace just for this project.
python3 -m venv ~/.venvs/llm

source ~/.venvs/llm/bin/activate
👉 What happens here:
python3 -m venvcreates a new isolated environment namedllm.source .../activateswitches you into that environment, so all installs stay inside it.
📦 Step 2: Install the LLM Tool
Now, let’s install LLM.
pip install -U llm👉 This gives us the llm command we’ll use to talk to models.
🛠️ Step 3: Install Extra Dependencies
Mistral needs a few extra packages:
pip install mlx

pip install sentencepiece
👉 mlx is Apple’s library that helps models run efficiently on Mac.
👉 sentencepiece helps the model break down text into tokens (words/pieces).
🔌 Step 4: Install the Mistral Plugin
We now connect LLM with Mistral:
llm install llm-mlx👉 This installs the llm-mlx plugin, which allows LLM to use Mistral models via Apple’s MLX framework.
Verify the plugin with this
llm pluginsresult should look like that:
[
  {
    "name": "llm-mlx",
    "hooks": [
      "register_commands",
      "register_models"
    ],
    "version": "0.4"
  }
]
⬇️ Step 5: Download the Model
Now for the fun part — downloading Mistral 7B.
llm mlx download-model mlx-community/Mistral-7B-Instruct-v0.3-4bit👉 This pulls down the model from the community in a compressed, 4-bit version (smaller and faster to run on laptops).
Verify the model is on your system:
llm models | grep -i mistraloutput should be something similar with this:
MlxModel: mlx-community/Mistral-7B-Instruct-v0.3-4bit (aliases: m7)🏷️ Step 6: Set a Shortcut (Alias)
Typing the full model name is long and annoying. Let’s create a shortcut:
llm aliases set m7 mlx-community/Mistral-7B-Instruct-v0.3-4bit👉 From now on, we can just use -m m7 instead of the full model name.
💡 Step 7: One last thing
if you are using Homebrew then most probably you already have OpenSSL on your system, if you do not know what we are talking about, then you are using LibreSSL and you need to make a small change:
pip install "urllib3<2"only if you are using brew run:
brew install openssl@3💬 Step 8: Ask Your First Question
Time to chat with Mistral!
llm -m m7 'Capital of Greece ?'
👉 Expected result:
The model should respond with:
Athens🎉 Congratulations — you’ve just run a powerful AI model locally on your Mac!
👨💻 A More Technical Example
Mistral isn’t only for trivia — it can help with real command-line tasks too.
For example, let’s ask it something more advanced:
llm -m m7 'On Arch Linux, give only the bash command using find
 that lists files in the current directory larger than 1 GB,
 do not cross filesystem boundaries. Output file sizes in
 human-readable format with GB units along with the file paths.
 Return only the command.'
👉 Mistral responds with:
find . -type f -size +1G -exec du -sh {} +
💡 What this does:
find . -type f -size +1G→ finds files bigger than 1 GB in the current folder.-exec ls -lhS {} ;→ runslson each file to display the size in human-readable format (GB).
This is the kind of real-world productivity boost you get by running models locally.
Full text example output:
This command will find all files (
-type f) larger than 1 GB (-size +1G) in the current directory (.) and execute thedu -shcommand on each file to display the file size in a human-readable format with GB units (-h). The+after-exectellsfindto execute the command once for each set of found files, instead of once for each file.
🌟 Why This Is Cool
- 🔒 No internet needed once the model is downloaded.
- 🕵️ Privacy: your text never leaves your laptop.
- 🧪 Flexible: you can try different open-source models, not just Mistral.
though it won’t be as fast as running it in the cloud.
That’s it !
PS. These are my personal notes from my home lab; AI was used to structure and format the final version of this blog post.
🖥️ I’ve been playing around with the python cli LLM and Perplexity, trying to get a setup that works nicely from the command line. Below are my notes, with what worked, what I stumbled on, and how you can replicate it.
📌 Background & Why
I like working with tools that let me automate or assist me with shell commands, especially when exploring files, searching, or scripting stuff. LLM + Perplexity give me that power: AI suggestions + execution.
If you’re new to this, it helps you avoid googling every little thing, but still keeps you in control.
Also, I have a Perplexity Pro account, and I want to learn how to use it from my Linux command line.
⚙️ Setup: Step by Step
1️⃣ Prepare a Python virtual environment
I prefer isolating things so I don’t mess up my global Python. Here’s how I did it by creating a new python virtual environment and activate it:
PROJECT="llm"

python3 -m venv ~/.venvs/${PROJECT}
source ~/.venvs/${PROJECT}/bin/activate

# Install llm project
pip install -U ${PROJECT}
This gives you a clean llm install.
2️⃣ Get Perplexity API key 🔑
You’ll need an API key from Perplexity to use their model via LLM.
-
Go to Perplexity.ai 🌐
-
Sign in / register
-
Go to your API keys page: https://www.perplexity.ai/account/api/keys
-
Copy your key
Be careful, in order to get the API, you need to type your Bank Card details. In my account, I have a free tier of 5 USD. You can review your tokens via the Usage metrics in Api Billing section.
3️⃣ Install plugins for LLM 🧩
I used two plugins:
-
⚡
llm-cmd— for LLM to suggest/run shell commands -
🔍
llm-perplexity— so LLM can use Perplexity as a model provider
Commands:
llm install llm-cmd

llm install llm-perplexity
Check what’s installed:
llm plugins
Sample output:
[
  {
    "name": "llm-cmd",
    "hooks": [
      "register_commands"
    ],
    "version": "0.2a0"
  },
  {
    "name": "llm-perplexity",
    "hooks": [
      "register_models"
    ],
    "version": "2025.6.0"
  }
]
4️⃣ Configure your Perplexity key inside LLM 🔐
Tell LLM your Perplexity key so it can use it:
❯ llm keys set perplexity
# then paste your API key when prompted
Verify:
❯ llm keys
perplexity
You should just see “perplexity” listed (or the key name), meaning it is stored.
Available models inside LLM 🔐
Verify and view what are the available models to use:
llm models
the result on my setup, with perplexity enabled is:
OpenAI Chat: gpt-4o (aliases: 4o)
OpenAI Chat: chatgpt-4o-latest (aliases: chatgpt-4o)
OpenAI Chat: gpt-4o-mini (aliases: 4o-mini)
OpenAI Chat: gpt-4o-audio-preview
OpenAI Chat: gpt-4o-audio-preview-2024-12-17
OpenAI Chat: gpt-4o-audio-preview-2024-10-01
OpenAI Chat: gpt-4o-mini-audio-preview
OpenAI Chat: gpt-4o-mini-audio-preview-2024-12-17
OpenAI Chat: gpt-4.1 (aliases: 4.1)
OpenAI Chat: gpt-4.1-mini (aliases: 4.1-mini)
OpenAI Chat: gpt-4.1-nano (aliases: 4.1-nano)
OpenAI Chat: gpt-3.5-turbo (aliases: 3.5, chatgpt)
OpenAI Chat: gpt-3.5-turbo-16k (aliases: chatgpt-16k, 3.5-16k)
OpenAI Chat: gpt-4 (aliases: 4, gpt4)
OpenAI Chat: gpt-4-32k (aliases: 4-32k)
OpenAI Chat: gpt-4-1106-preview
OpenAI Chat: gpt-4-0125-preview
OpenAI Chat: gpt-4-turbo-2024-04-09
OpenAI Chat: gpt-4-turbo (aliases: gpt-4-turbo-preview, 4-turbo, 4t)
OpenAI Chat: gpt-4.5-preview-2025-02-27
OpenAI Chat: gpt-4.5-preview (aliases: gpt-4.5)
OpenAI Chat: o1
OpenAI Chat: o1-2024-12-17
OpenAI Chat: o1-preview
OpenAI Chat: o1-mini
OpenAI Chat: o3-mini
OpenAI Chat: o3
OpenAI Chat: o4-mini
OpenAI Chat: gpt-5
OpenAI Chat: gpt-5-mini
OpenAI Chat: gpt-5-nano
OpenAI Chat: gpt-5-2025-08-07
OpenAI Chat: gpt-5-mini-2025-08-07
OpenAI Chat: gpt-5-nano-2025-08-07
OpenAI Completion: gpt-3.5-turbo-instruct (aliases: 3.5-instruct, chatgpt-instruct)
Perplexity: sonar-deep-research
Perplexity: sonar-reasoning-pro
Perplexity: sonar-reasoning
Perplexity: sonar-pro
Perplexity: sonar
Perplexity: r1-1776
Default: gpt-4o-mini
as of this blog post date written.
🚀 First Use: Asking LLM to Suggest a Shell Command
okay, here is where things get fun.
I started with something simply, identify all files that are larger than 1GB and I tried this prompt:
llm -m sonar-pro cmd "find all files in this local directory that are larger than 1GB"
It responded with something like:
Multiline command - Meta-Enter or Esc Enter to execute
> find . -type f -size +1G -exec ls -lh {} ;

  ## Citations:
  [1] https://tecadmin.net/find-all-files-larger-than-1gb-size-in-linux/
  [2] https://chemicloud.com/kb/article/find-and-list-files-bigger-or-smaller-than-in-linux/
  [3] https://manage.accuwebhosting.com/knowledgebase/3647/How-to-Find-All-Files-Larger-than-1GB-in-Linux.html
  [4] https://hcsonline.com/support/resources/blog/find-files-larger-than-1gb-command-line

Aborted!
I did not want to execute this, so I interrupted the process.
💡 Tip: Always review AI-suggested commands before running them — especially if they involve find /, rm -rf, or anything destructive.
📂 Example: Running the command manually
If you decide to run manually, you might do:
find . -xdev -type f -size +1G -exec ls -lh {} ;
My output was like:
-rw-r--r-- 1 ebal ebal 3.5G Jun  9 11:20 ./.cache/colima/caches/9efdd392c203dc39a21e37036e2405fbf5b0c3093c55f49c713ba829c2b1f5b5.raw
-rw-r--r-- 1 ebal ebal 13G Jun  9 11:58 ./.local/share/rancher-desktop/lima/0/diffdisk
Cool way to find big files, especially if disk is filling up 💾.
🤔 Things I Learned / Caveats
-
⚠️ AI-suggested commands are helpful, but sometimes they assume things (permissions, paths) that I didn’t expect.
-
🐍 Using a virtual env helps avoid version mismatches.
-
🔄 The plugins sometimes need updates; keep track of version changes.
-
🔑 Be careful with your API key — don’t commit it anywhere.
✅ Summary & What’s Next
So, after doing this:
-
🛠️ Got
llmworking with Perplexity -
📜 Asked for shell commands
-
👀 Reviewed + tested output manually
Next, I would like to run Ollama in my home lab. I don’t have a GPU yet, so I’ll have to settle for Docker on an old CPU, which means things will be slow and require some patience. I also want to play around with mixing an LLM and tools like Agno framework to set up a self-hosted agentic solution for everyday use.
That’s it !
PS. These are my personal notes from my home lab; AI was used to structure and format the final version of this blog post.
Managing SSL/TLS certificates for your domains can be effortless with the right tools. In this post, I’ll walk you through using acme.sh and LuaDNS to issue wildcard certificates for your domain.
Let’s dive into the step-by-step process of setting up DNS-based validation using the LuaDNS API.
📋 Prerequisites
- You own a domain and manage its DNS records with LuaDNS.
- You have
acme.shinstalled. - You’ve generated an API token from your LuaDNS account.
🧼 Step 1: Clean Up Old Certificates (Optional)
If you’ve previously issued a certificate for your domain and want to start fresh, you can remove it with:
acme.sh --remove -d balaskas.grThis will remove the certificate metadata from acme.sh, but not delete the actual files. You’ll find those under:
/root/.acme.sh/balaskas.grFeel free to delete them manually if needed.
🔑 Step 2: Set Your LuaDNS API Credentials
Log into your LuaDNS account and generate your API token from:
👉 https://api.luadns.com/settings
Then export your credentials in your shell session:
export LUA_Email="youremail@example.com"
export LUA_Key="your_luadns_api_key"
Example:
export LUA_Email="api.luadns@example.org"
export LUA_Key="a86ee24d7087ad83dc51dadbd35b31e4"
📜 Step 3: Issue the Wildcard Certificate
Now you can issue a certificate using DNS-01 validation via the LuaDNS API:
acme.sh --issue --dns dns_lua -d balaskas.gr -d *.balaskas.gr --server letsencryptThis command will:
- Use Let’s Encrypt as the Certificate Authority.
- Add two DNS TXT records (
_acme-challenge.balaskas.gr) using LuaDNS API. - Perform domain validation.
- Remove the TXT records after verification.
- Issue and store the certificate.
Sample output will include steps like:
Adding txt value: ... for domain: _acme-challenge.balaskas.gr
The txt record is added: Success.
Verifying: balaskas.gr
Verifying: *.balaskas.gr
Success
Removing DNS records.
Cert success.
You’ll find the certificate and key files in:
/root/.acme.sh/balaskas.gr/File paths:
- Certificate:
balaskas.gr.cer - Private Key:
balaskas.gr.key - CA Chain:
ca.cer - Full Chain:
fullchain.cer
✅ Step 4: Verify the Certificate
You can check your currently managed certificates with:
acme.sh --cron --listOutput should look like:
Main_Domain        KeyLength  SAN_Domains            CA                    Created                       Renew
balaskas.gr       ""         *.balaskas.gr         LetsEncrypt.org       Thu Apr 17 14:39:24 UTC 2025  Mon Jun 16 14:39:24 UTC 2025
🎉 Done!
That’s it! You’ve successfully issued and installed a wildcard SSL certificate using acme.sh with LuaDNS.
You can now automate renewals via cron, and integrate the certificate into your web server or load balancer.
🔁 Bonus Tip: Enable Auto-Renewal
acme.sh is cron-friendly. Just make sure your environment has access to the LUA_Key and LUA_Email variables, either by exporting them in a script or storing them in a config file.
Let me know if you’d like this blog post exported or published to a static site generator (like Hugo, Jekyll, or Hexo) or posted somewhere specific!
That’s it !
This blog post was made with chatgpt
a blog post series to my homelab
check here for Introduction to Traefik - Part Two
Part Three
In this blog post series, I will connect several docker containers and a virtual machine behind the Traefik reverse proxy on my homelab, and set up Let’s Encrypt for TLS.
In this article, I will try to connect a virtual machine to the Traefik reverse proxy. In Linux, Docker containers and virtual machines (VMs) run on different networks due to the way their networking is set up. To enable communication between Docker containers and VMs, we need to configure somekind of network bridging, port forwarding, or use a common network interface that allows them to communicate with each other. To simplify the setup, I will try to put Traefik docker container to a common network with the virtual machine.
Disclaimer: This homelab is intended for testing and learning purposes, as are the services we’ll explore. Make sure it fits your needs; I’m not suggesting you copy/paste everything here as-is. In the end, I may decide to delete this homelab and create a new one! But for now, let’s enjoy this journey together. Thank you!
I’ve also made a short video to accompany this blog post:

Virtual Machine
I use Qemu/KVM (kernel virtual machine) in my home lab. I also use terraform with libvirtd to automate my entire setup. That said, this post is not about that !
For the purpose of this article, I created an ubuntu 24.04 LTS running transmission service. It’s IP is: 192.168.122.79 and listens to TCP Port: 9091. Transmission also has configured with a Basic Auth authentication mechanism which username and password are the defaults: transmission:transmission.
Setup diagram
something similar to the below scheme
                       ┌────┐
                       │    │
                       │    │   192.168.122.x:9091
                       │    │
    ┌────┐             │    │        ┌───────┐
    │    │             │    │        │       │
    │    │  ─────────► │    ├───────►│       │
  ┌─└────┘─┐           │    │        │       │
  └────────┘           │    │        └───────┘
  192.168.1.3          │    │            VM
                       │    │
                       │    │        ┌──┐┌──┐
                       │    ├───────►│  ││  │whoami
                       └────┘        └──┘└──┘   172.19.0.x
                                     ┌──┐┌──┐
                       Traefik       │  ││  │
                                     └──┘└──┘
                                      docker
                                     containers
Traefik Network Mode
By default the network mode in docker compose is bridge mode which isolates the docker containers from the host. In the bridge mode our docker containers can communicate with each other directly.
But we need to either bridge our VM network (192.168.122.x/24) to the 172.19.0.x/24 network, or—what seems easier to me—change Traefik’s network mode from bridge to host.
In docker compose yaml file, in traefik service we need to make two changes:
first add the host network mode:
    # Very important in order to access the VM
    network_mode: host
and by using host we can now remove any port declaration
remove:
    ports:
      # The Web UI (enabled by --api.insecure=true)
      - 8080:8080
      # The HTTP port
      - 80:80
so our docker-compose.yml now looks like:
---
services:
  traefik:
    image: traefik:v3.3
    container_name: traefik
    hostname: traefik
    env_file:
      - path: ./.env
        required: true
    restart: unless-stopped
    volumes:
      - ./traefik:/etc/traefik
      - /var/run/docker.sock:/var/run/docker.sock:ro
    # Add health check
    healthcheck:
      test: curl -s --fail http://127.0.0.1:8080/ping
      interval: 30s
      retries: 3
      timeout: 10s
      start_period: 10s
    # Very important in order to access the VM
    network_mode: host

  # A container that exposes an API to show its IP address
  whoami:
    image: traefik/whoami
    container_name: whoami
    hostname: whoami
    depends_on:
      - traefik
    labels:
        - "traefik.enable=true"                                       # To enable whoami to Traefik
        - "traefik.http.routers.whoami.rule=Host(`whoami.localhost`)" # Declare the host rule for this service
        - "traefik.http.routers.whoami.entrypoints=web"               # Declare the EntryPoint
Start services:
docker compose up -dTest whoami
let us test now if whoami service works
curl -H Host:whoami.localhost http://127.0.0.1output:
Hostname: whoami
IP: 127.0.0.1
IP: ::1
IP: 172.19.0.2
RemoteAddr: 172.19.0.1:43968
GET / HTTP/1.1
Host: whoami.localhost
User-Agent: curl/8.12.1
Accept: */*
Accept-Encoding: gzip
X-Forwarded-For: 127.0.0.1
X-Forwarded-Host: whoami.localhost
X-Forwarded-Port: 80
X-Forwarded-Proto: http
X-Forwarded-Server: traefik
X-Real-Ip: 127.0.0.1
okay, seems it works are before.
Transmission
as mentioned above, our transmission application runs on the virtual machine. It is protected by a Basic Authentication setup and listens on a TCP port.
Let’s test the connection:
curl 192.168.122.79:9091result is:
<h1>401: Unauthorized</h1>To add Basic Auth to curl is simple:
curl -u transmission:transmission 192.168.122.79:9091now the output is:
<h1>301: Moved Permanently</h1>we can add -v to see more details:
curl -v -u transmission:transmission 192.168.122.79:9091full output:
*   Trying 192.168.122.79:9091...
* Connected to 192.168.122.79 (192.168.122.79) port 9091
* using HTTP/1.x
* Server auth using Basic with user 'transmission'
> GET / HTTP/1.1
> Host: 192.168.122.79:9091
> Authorization: Basic dHJhbnNtaXNzaW9uOnRyYW5zbWlzc2lvbg==
> User-Agent: curl/8.12.1
> Accept: */*
>
* Request completely sent off
< HTTP/1.1 301 Moved Permanently
< Server: Transmission
< Access-Control-Allow-Origin: *
< Location: /transmission/web/
< Date: Thu, 27 Feb 2025 15:47:02 GMT
< Content-Length: 31
< Content-Type: text/html; charset=ISO-8859-1
<
* Connection #0 to host 192.168.122.79 left intact
<h1>301: Moved Permanently</h1>
The Location section is interesting: Location: /transmission/web/
Authorization header
by looking very careful the above output, we see that curl uses the Authorization header for Basic Auth.
This is interesting and we can use this.
Let’s try the command:
curl -H "Authorization: Basic dHJhbnNtaXNzaW9uOnRyYW5zbWlzc2lvbg==" http://192.168.122.79:9091/output:
<h1>301: Moved Permanently</h1>okay !
So, another way to access transmission is via Authorization header. Curl sends the credentials through base64 encoding, which can be reproduced by
echo -n "transmission:transmission" | base64and we verify the output:
dHJhbnNtaXNzaW9uOnRyYW5zbWlzc2lvbg==Traefik file provider
For the purpose of this lab, we want to access the application on the VM from localhost without providing any credentials, with Traefik handling everything.
                                    ┌─────────┐
http://localhost/transmission/ ---> | Traefik | --> VM (IP:PORT + Basic Auth)/transmision/
                                    └─────────┘
To do that, we need to introduce a PathPrefix Rule to Traefik so it redirects every request for /transmission to the VM. And what a better place to introduce the file provider on our static Traefik configuration
    # Enable file provider
    file:
        directory: /etc/traefik/dynamic/
        watch: true
under our docker provider.
so the entire traefik/traefik.yml should look like:
# The /ping health-check URL
ping: {

}

# API and dashboard configuration
api:
    insecure: true

# Debug log
log:
    filePath: /etc/traefik/traefik.log
    level: DEBUG

# Enable EntryPoints
entryPoints:
    web:
        address: ":80"
        reusePort: true

# Providers
providers:
    # Enable docker provider
    docker:
        exposedByDefault: false

    # Enable file provider
    file:
        directory: /etc/traefik/dynamic/
        watch: true
Dynamic Directory
I am sure you have already noticed that we also have introduced a new directory under our Traefik folder and instructed Traefik to watch it. This is extremely useful because Traefik will automatically reload any configuration in that folder without the need to restart (stop/start or down/up) the Traefik service.
As this change is on static configuration, we need to stop/start the services:
docker compose downCreate the dynamic directory:
mkdir -pv ./traefik/dynamic/

ls -la ./traefik/dynamic/
and
docker compose up -dTraefik Design
To help you understand how traefik works,
                    HTTP        HTTP

┌───────────┐      ┌──────┐   ┌──────────┐   ┌───────┐
│           │      │      │   │          │   │       │
│EntryPoints│ ───► │Routes│──►│Middleware│──►│Service│
│           │      │      │   │          │   │       │
└───────────┘      └──────┘   └──────────┘   └───────┘
We have alredy explained EntryPoints on our previous article, so we are going to focus on routers, middlewares and services.
Traefik Services
To avoid any complicated explanation, the Traefik Service is the final destination of an HTTP request.
For our example, should look like the below config. Please be aware, the <service name> is a placeholder for later.
http:
  services:
    <service-name>:
      loadBalancer:
        servers:
          - url: 'http://192.168.122.79:9091'
Traefik Middlewares
As we already mentioned above, we need to send login credentials to transmission. Be aware <middleware name> is a place holder for later.
http:
  middlewares:
    <middlewar-name>:
      headers:
        customRequestHeaders:
          Authorization: "Basic dHJhbnNtaXNzaW9uOnRyYW5zbWlzc2lvbg=="
Traefik Routes
Traefik HTTP Routes are part of Traefik’s dynamic configuration and define how HTTP requests are handled and routed to the correct services.
Which means the routers is the component that connects everything (EntryPoint, Middleware, and Service) together. This is also where we add our PathPrefix rule for the Transmission location.
Be aware <router|service|middleware name> is a place holder for later.
eg.
http:
  routers:
    <router-name>>:
      entryPoints: web
      service: <service-name>
      rule: PathPrefix(`/transmission`)
      middlewares:
        - <middleware-name>>
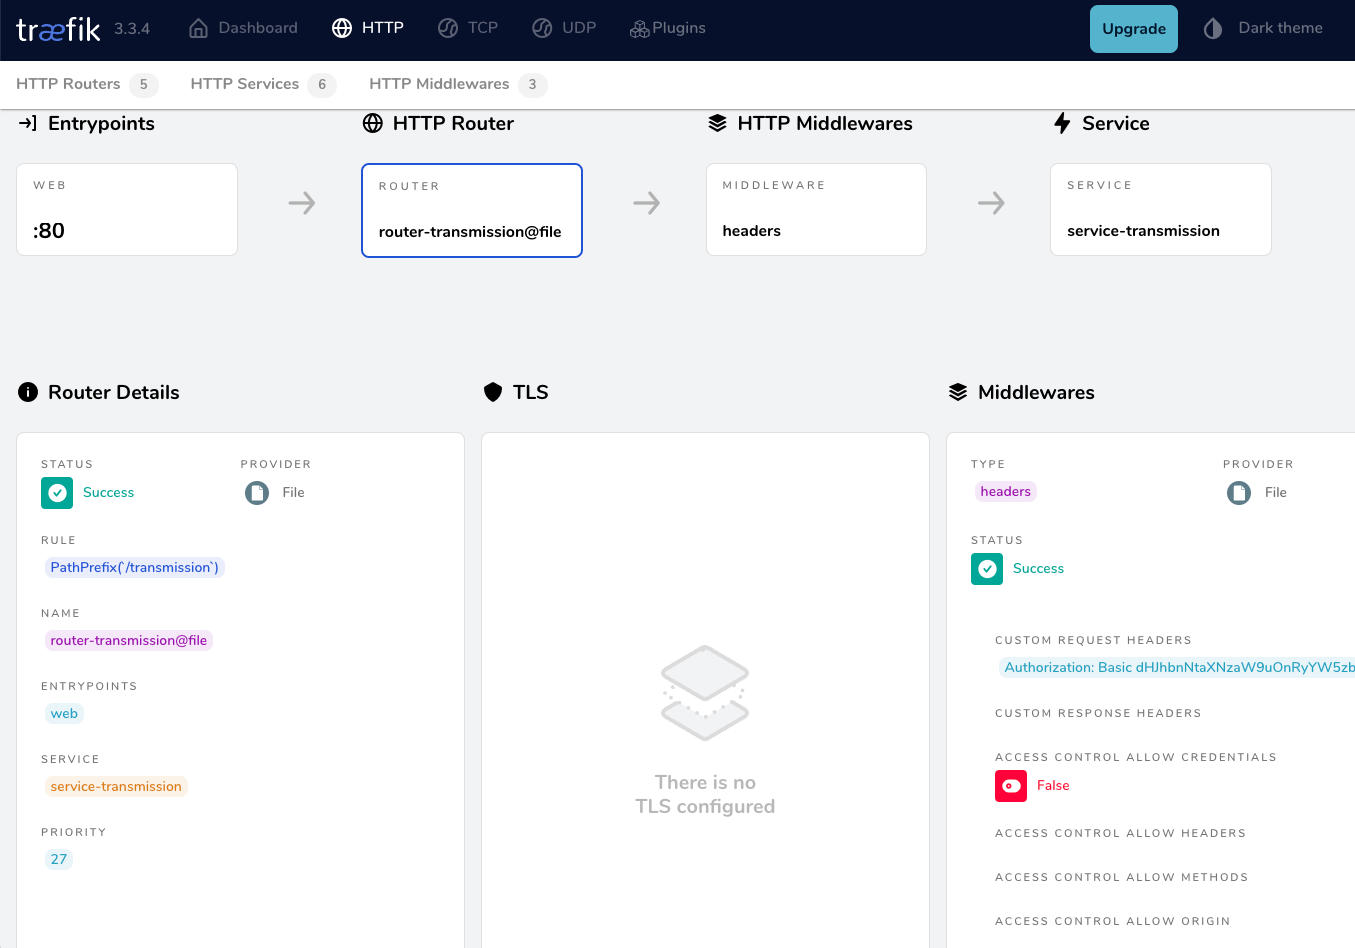
Traefik dynamic configuration
We are ready to pull things together.
Create a file named transmission yaml under the dynamic configuration directory:
./traefik/dynamic/transmission.yml
http:

  middlewares:
    middleware-transmission:
      headers:
        customRequestHeaders:
          Authorization: "Basic dHJhbnNtaXNzaW9uOnRyYW5zbWlzc2lvbg=="

  routers:
    router-transmission:
      entryPoints: web
      service: service-transmission
      rule: PathPrefix(`/transmission`)
      middlewares:
        - middleware-transmission

  services:
    service-transmission:
      loadBalancer:
        servers:
          - url: 'http://192.168.122.79:9091'
NO need to restart our services with dynamic configuration!
Test Traefik new transmission route
from command line
curl localhost/transmission/output:
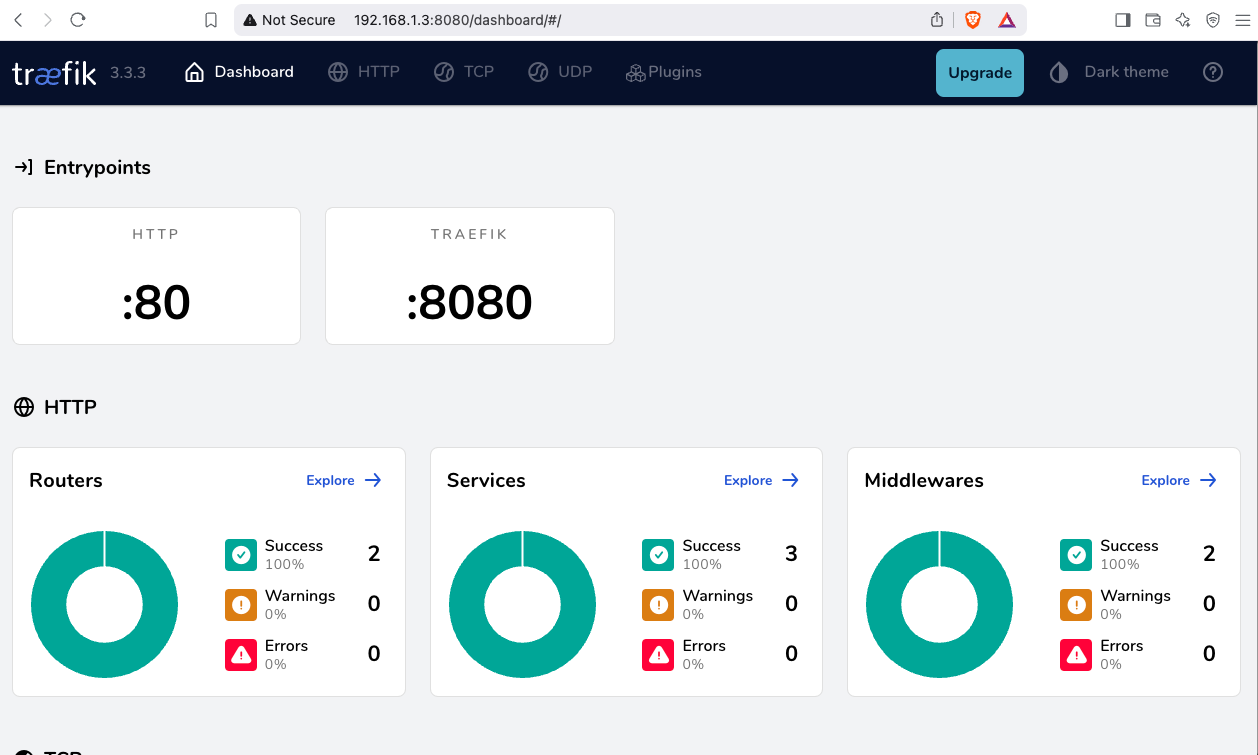
<h1>301: Moved Permanently</h1>from dashboard
from browser
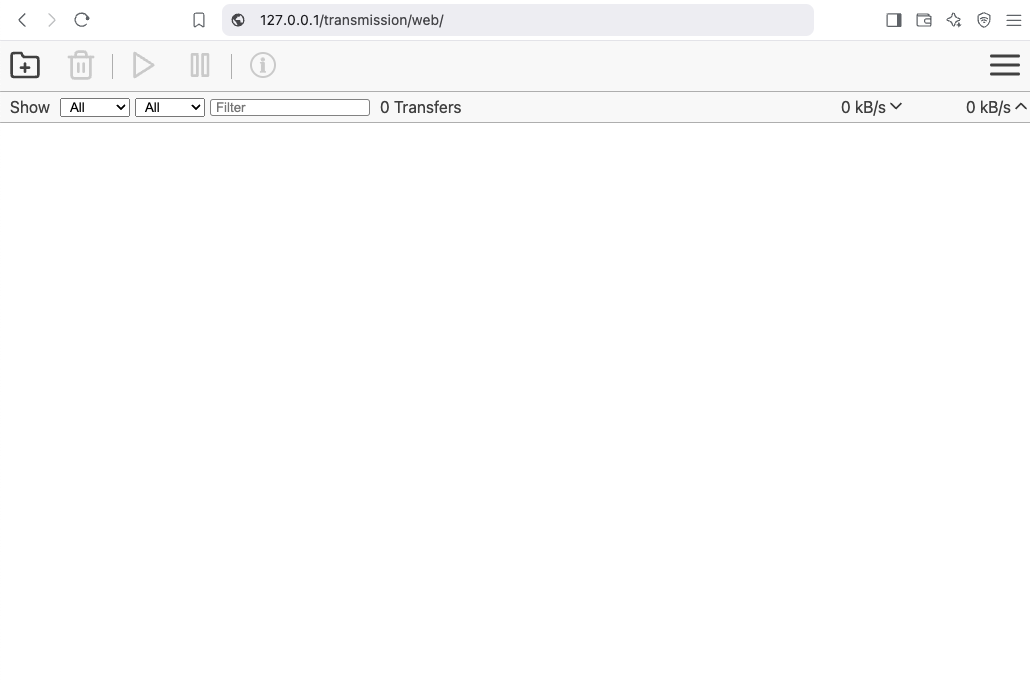
That’s It !!
docker compose down
a blog post series to my homelab
check here for Introduction to Traefik - Part One
Part Two
In this blog post series, I will connect several docker containers and a virtual machine behind the Traefik reverse proxy on my homelab, and set up Let’s Encrypt for TLS. In this post, I will connect our first docker container to the Traefik reverse proxy for testing and to learn how to do this.
I’ve also made a short video to accompany this blog post:

WhoAmI?
Traefik, whoami is often used as a simple test service to demonstrate how Traefik handles routing, especially when using dynamic routing and reverse proxy setups.
  # A container that exposes an API to show its IP address
  whoami:
    image: traefik/whoami
    container_name: whoami
    hostname: whoami
our updated docker compose file should look like:
docker-compose.yml
---
services:
  traefik:
    image: traefik:v3.3
    container_name: traefik
    hostname: traefik
    env_file:
      - path: ./.env
        required: true
    restart: unless-stopped
    ports:
      # The Web UI (enabled by --api.insecure=true)
      - 8080:8080
      # The HTTP port
      - 80:80
    volumes:
      - ./traefik:/etc/traefik
      - /var/run/docker.sock:/var/run/docker.sock:ro

  # A container that exposes an API to show its IP address
  whoami:
    image: traefik/whoami
    container_name: whoami
    hostname: whoami
Start all the services
docker compose up -doutput:
$ docker compose up -d
[+] Running 3/3
 ✔ Network homelab_default  Created    0.3s
 ✔ Container whoami         Started    2.2s
 ✔ Container traefik        Started    2.3s
Test WhoAmI - the wrong way
We can test our traefik reverse proxy with
curl -H Host:whoami.localhost http://127.0.0.1but the result should be:
404 page not foundWhy ?
We have not yet changed our traefik configuration file to enable an EntryPoint. EntryPoints are the network entry points into Traefik.
So let’s go back one step.
docker compose down
Traefik Configuration
The simplest approach is to update our configuration file and add a new EntryPoint. However, I’d like to take this opportunity to expand our configuration a little.
EntryPoints are Static Configuration, so they must be included on traefik.yml file.
## Static configuration
entryPoints:
  web:
   address: ":80"
so traefik/traefik.yml should look like:
# API and dashboard configuration
api:
  insecure: true

## Static configuration
entryPoints:
  web:
   address: ":80"
That should work, but given the opportunity, let’s enhance our Traefik configuration by including:
Ping
# The /ping health-check URL
ping: {

}
It would be useful to add a health check in the Docker Compose file later on.
Logs
This is how to enable the DEBUG (or INFO - just replace the verb in level)
# Debug log
log:
  filePath: /etc/traefik/traefik.log
  level: DEBUG
Docker provider
I want to explicitly include the Docker provider with a caveat: I don’t want to automatically expose all my docker containers behind Traefik. Instead, I prefer to manually add each docker container that I want to expose to the internet, rather than exposing all of them by default.
providers:
  # Enable docker provider
  docker: {
    exposedByDefault: false
  }
Traefik Configuration file updated
and now traefik/traefik.yml looks like:
# The /ping health-check URL
ping: {

}

# API and dashboard configuration
api:
    insecure: true

# Debug log
log:
    filePath: /etc/traefik/traefik.log
    level: DEBUG

# Enable EntryPoints
entryPoints:
    web:
        address: ":80"
        reusePort: true

# Providers
providers:
    # Enable docker provider
    docker: {
        exposedByDefault: false
    }
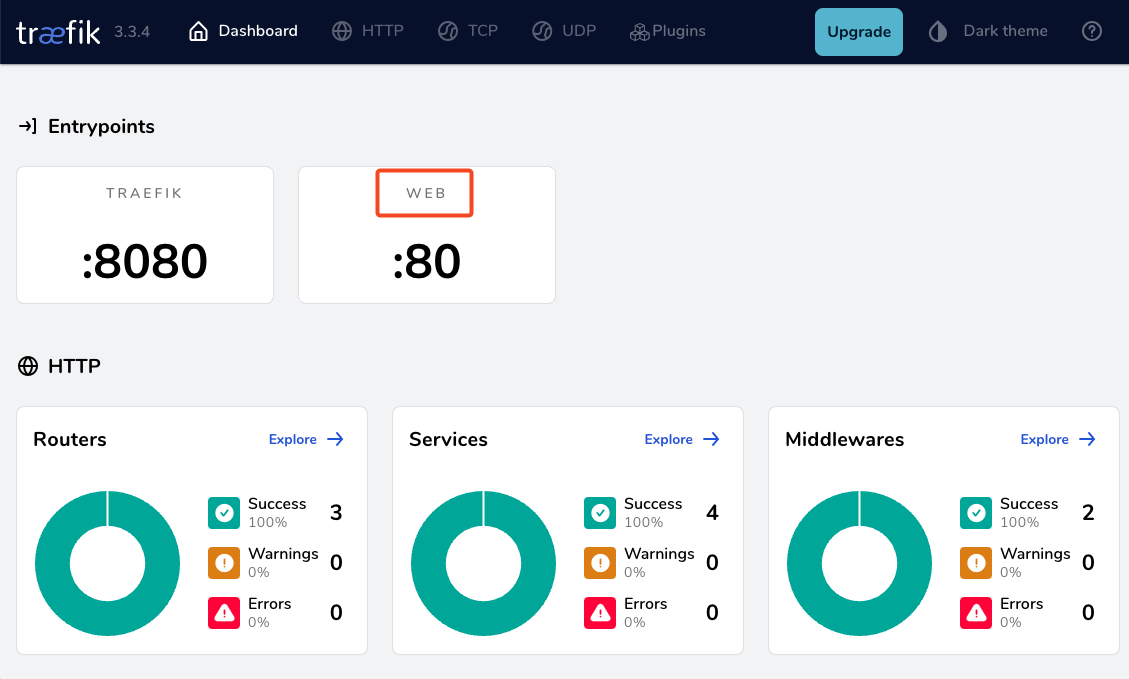
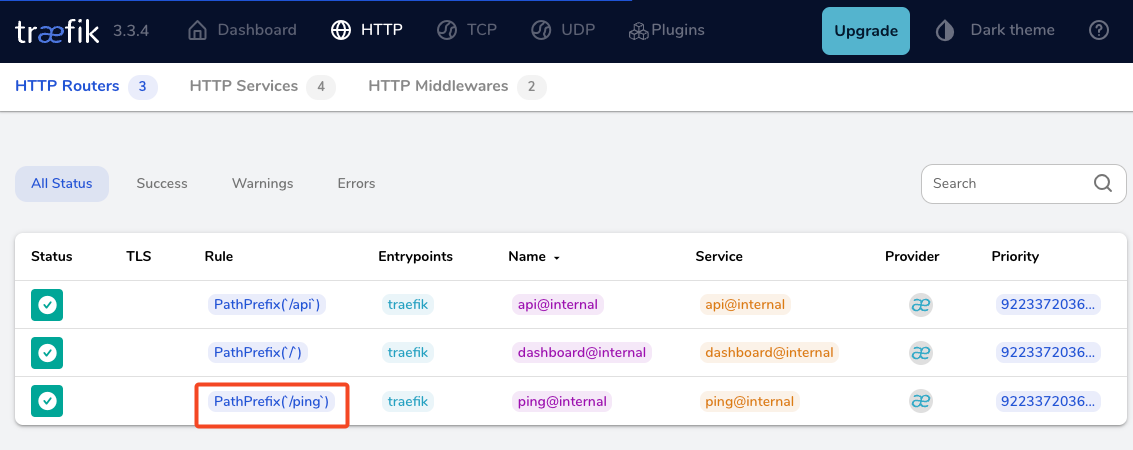
by running
docker compose up traefik -dwe can review Traefik dashboard with the new web EntryPoint and ping
WhoAmI - the correct way
okay, we now have our EntryPoint in Traefik but we need to explicit expose our whoami docker container and in order to do that, we need to add some labels!
  # A container that exposes an API to show its IP address
  whoami:
    image: traefik/whoami
    container_name: whoami
    hostname: whoami
    labels:
        - "traefik.enable=true" # To enable whoami to Traefik
        - "traefik.http.routers.whoami.rule=Host(`whoami.localhost`)" # Declare the host rule for this service
        - "traefik.http.routers.whoami.entrypoints=web" # Declare the EntryPoint
let’s put everything together:
---
services:
  traefik:
    image: traefik:v3.3
    container_name: traefik
    hostname: traefik
    env_file:
      - path: ./.env
        required: true
    restart: unless-stopped
    ports:
      # The Web UI (enabled by --api.insecure=true)
      - 8080:8080
      # The HTTP port
      - 80:80
    volumes:
      - ./traefik:/etc/traefik
      - /var/run/docker.sock:/var/run/docker.sock:ro

  # A container that exposes an API to show its IP address
  whoami:
    image: traefik/whoami
    container_name: whoami
    hostname: whoami
    labels:
        - "traefik.enable=true" # To enable whoami to Traefik
        - "traefik.http.routers.whoami.rule=Host(`whoami.localhost`)" # Declare the host rule for this service
        - "traefik.http.routers.whoami.entrypoints=web" # Declare the EntryPoint
docker compose up -d
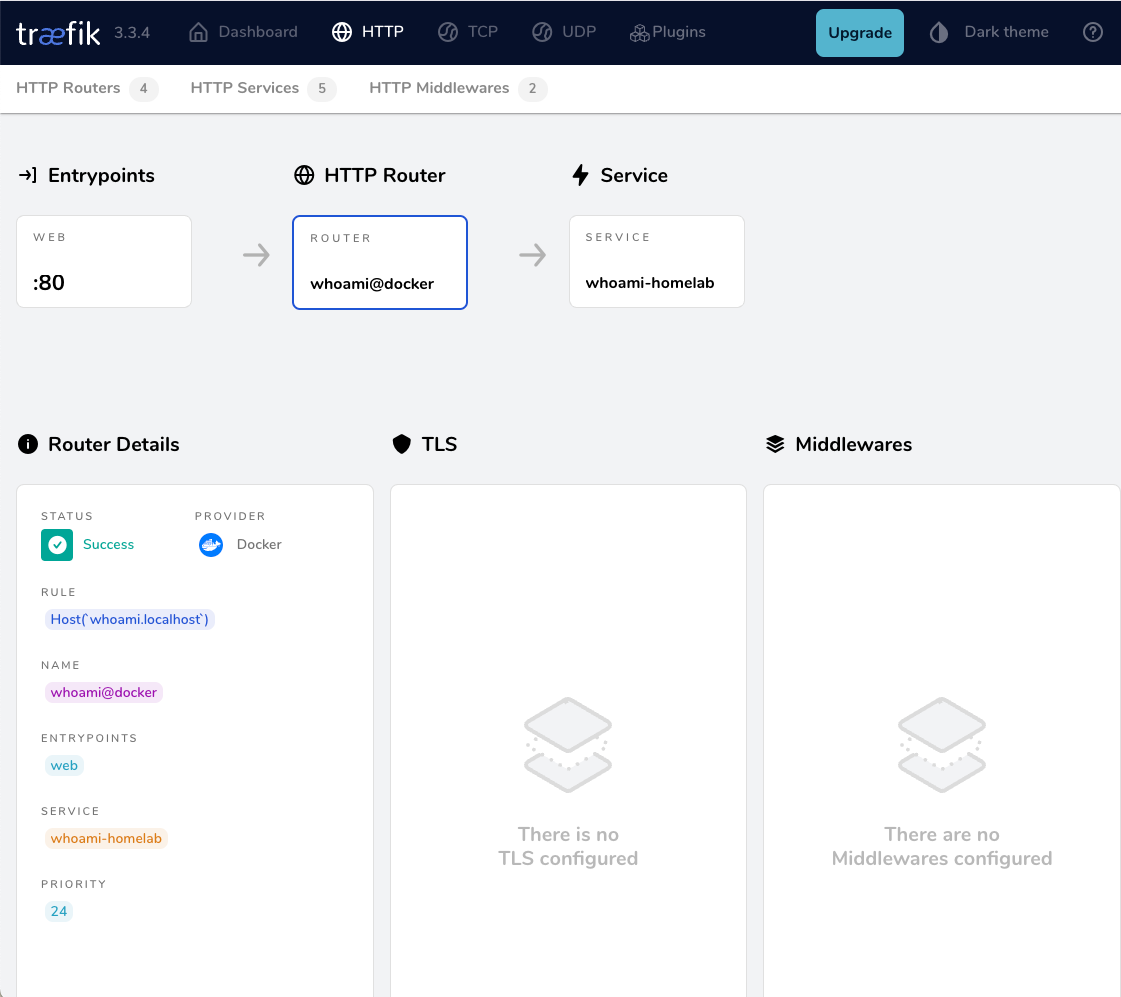
Test Who Am I
curl -H Host:whoami.localhost http://127.0.0.1output:
Hostname: whoami
IP: 127.0.0.1
IP: ::1
IP: 172.19.0.3
RemoteAddr: 172.19.0.2:41276
GET / HTTP/1.1
Host: whoami.localhost
User-Agent: curl/8.12.1
Accept: */*
Accept-Encoding: gzip
X-Forwarded-For: 172.19.0.1
X-Forwarded-Host: whoami.localhost
X-Forwarded-Port: 80
X-Forwarded-Proto: http
X-Forwarded-Server: traefik
X-Real-Ip: 172.19.0.1
Health Checks and Depends
before finishing this article, I would like to include two more things.
Traefik Health Check
We added above the ping section on Traefik configuration, it is time to use it. On our docker compose configuration file, we can add a health check section for Traefik service.
We can test this from our command line
curl -s --fail http://127.0.0.1:8080/pingthe result should be an OK !
and we can extend the Traefik service to include this
    healthcheck:
      test: curl -s --fail http://127.0.0.1:8080/ping
      interval: 30s
      retries: 3
      timeout: 10s
      start_period: 10s
Depends On
The above health check option can be used to specify service dependencies in docker compose, so we can ensure that the whoami docker service starts after Traefik.
    depends_on:
      - traefik
that means our docker compose yaml file should look like:
---
services:
  traefik:
    image: traefik:v3.3
    container_name: traefik
    hostname: traefik
    env_file:
      - path: ./.env
        required: true
    restart: unless-stopped
    ports:
      # The Web UI (enabled by --api.insecure=true)
      - 8080:8080
      # The HTTP port
      - 80:80
    volumes:
      - ./traefik:/etc/traefik
      - /var/run/docker.sock:/var/run/docker.sock:ro
    # Add health check
    healthcheck:
      test: curl -s --fail http://127.0.0.1:8080/ping
      interval: 30s
      retries: 3
      timeout: 10s
      start_period: 10s

  # A container that exposes an API to show its IP address
  whoami:
    image: traefik/whoami
    container_name: whoami
    hostname: whoami
    depends_on:
      - traefik
    labels:
        - "traefik.enable=true"                                       # To enable whoami to Traefik
        - "traefik.http.routers.whoami.rule=Host(`whoami.localhost`)" # Declare the host rule for this service
        - "traefik.http.routers.whoami.entrypoints=web"               # Declare the EntryPoint
a blog post series to my homelab

Part One
In this blog post, I will start by walking you through the process of setting up Traefik as a reverse proxy for your homelab. My setup involves using a virtual machine connected via a point-to-point VPN to a cloud VPS, along with several Docker containers on my homelab for various tasks and learning purposes. The goal is to expose only Traefik to the internet, which will then provide access to my internal homelab. For certain applications, I also use Tailscale, which I prefer not to expose directly to the internet. In short, I have a complex internal homelab setup, and in this post, we’ll simplify it!
I’ve made a short video to accompany this blog post:

docker compose
To begin, we need to set up a basic Docker Compose YAML file.
As of the time of writing this blog post, the latest Traefik Docker container image is version 3.3. It is best to declare a specific version instead of using “latest” tag.
image: traefik:v3.3Using an .env file in a Docker Compose configuration is important for several reasons, as for configure variables, secrets and it is easy to reuse though several services and to avoid hardcoding values. For traefik is important so we can configure the docker GID in order traefil to be able to use the docker socket.
eg. .env
# This is my user id
PUID=1001
# This is my docker group id
PGID=142
UMASK="002"
TZ="Europe/Athens"
DNS="88.198.92.222"
Next interesting topic is the volumes section.
I would like to mount a local directory for the traefik configuration, which I will later use with the dynamic file provider. Additionally, to enable Traefik to recongize our (future) docker images, we need to mount the docker socket too.
    volumes:
      - ./traefik:/etc/traefik
      - /var/run/docker.sock:/var/run/docker.sock
to conclude, here is a very basic docker compose yaml file:
docker-compose.yml
---
services:
  traefik:
    image: traefik:v3.3
    container_name: traefik
    hostname: traefik
    env_file:
      - path: ./.env
        required: true
    restart: unless-stopped
    ports:
      # The Web UI (enabled by --api.insecure=true)
      - 8080:8080
      # The HTTP port
      - 80:80
    volumes:
      - ./traefik:/etc/traefik
      - /var/run/docker.sock:/var/run/docker.sock
pull traefik docker image
we can explicitly get the Traefik docker container image
docker compose pull traefiktraefik configuration file
we also need to create the configuration file by enabling the API and the dashboard for now.
Create the directory and file
traefik/traefik.yml
and write this:
# API and dashboard configuration
api:
  insecure: true
Start traefik docker
We are ready start and run our Traefik docker container:
docker compose upresult is something like:
[+] Running 2/2
 ✔ Network homelab_default  Created       0.3s
 ✔ Container traefik        Created       0.4s
Attaching to traefik
To stop traefik from docker compose, we need to open a new terminal and type from the same directory
docker compose downor, we ca run the docker compose and detach it so it runs on the background:
docker compose up traefik -dThis is going to be useful for the future as we starting each service one by one.
Test traefik
Open your browser and click on: http://127.0.0.1:8080
you will see something like:
(this is a copy of my git repo of this post)
https://github.com/ebal/k8s_cluster/
Kubernetes, also known as k8s, is an open-source system for automating deployment, scaling, and management of containerized applications.
Notice The initial (old) blog post with ubuntu 22.04 is (still) here: blog post
- Prerequisites
- Git Terraform Code for the kubernetes cluster
- Control-Plane Node
- Ports on the control-plane node
- Firewall on the control-plane node
- Hosts file in the control-plane node
- Updating your hosts file
- No Swap on the control-plane node
- Kernel modules on the control-plane node
- NeedRestart on the control-plane node
- temporarily
- permanently
- Installing a Container Runtime on the control-plane node
- Installing kubeadm, kubelet and kubectl on the control-plane node
- Get kubernetes admin configuration images
- Initializing the control-plane node
- Create user access config to the k8s control-plane node
- Verify the control-plane node
- Install an overlay network provider on the control-plane node
- Verify CoreDNS is running on the control-plane node
- Worker Nodes
- Get Token from the control-plane node
- Is the kubernetes cluster running ?
- Kubernetes Dashboard
- Helm
- Install kubernetes dashboard
- Accessing Dashboard via a NodePort
- Patch kubernetes-dashboard
- Edit kubernetes-dashboard Service
- Accessing Kubernetes Dashboard
- Create An Authentication Token (RBAC)
- Creating a Service Account
- Creating a ClusterRoleBinding
- Getting a Bearer Token
- Browsing Kubernetes Dashboard
- Nginx App
- That’s it
In this blog post, I’ll share my personal notes on setting up a kubernetes cluster using kubeadm on Ubuntu 24.04 LTS Virtual Machines.
For this setup, I will use three (3) Virtual Machines in my local lab. My home lab is built on libvirt with QEMU/KVM (Kernel-based Virtual Machine), and I use Terraform as the infrastructure provisioning tool.
Prerequisites
- at least 3 Virtual Machines of Ubuntu 24.04 (one for control-plane, two for worker nodes)
- 2GB (or more) of RAM on each Virtual Machine
- 2 CPUs (or more) on each Virtual Machine
- 20Gb of hard disk on each Virtual Machine
- No SWAP partition/image/file on each Virtual Machine
Streamline the lab environment
To simplify the Terraform code for the libvirt/QEMU Kubernetes lab, I’ve made a few adjustments so that all of the VMs use the below default values:
- ssh port: 22/TCP
- volume size: 40G
- memory: 4096
- cpu: 4
Review the values and adjust them according to your requirements and limitations.
Git Terraform Code for the kubernetes cluster
I prefer maintaining a reproducible infrastructure so that I can quickly create and destroy my test lab. My approach involves testing each step, so I often destroy everything, copy and paste commands, and move forward. I use Terraform to provision the infrastructure. You can find the full Terraform code for the Kubernetes cluster here: k8s cluster - Terraform code.
If you do not use terraform, skip this step!
You can git clone the repo to review and edit it according to your needs.
git clone https://github.com/ebal/k8s_cluster.git
cd tf_libvirt
You will need to make appropriate changes. Open Variables.tf for that. The most important option to change, is the User option. Change it to your github username and it will download and setup the VMs with your public key, instead of mine!
But pretty much, everything else should work out of the box. Change the vmem and vcpu settings to your needs.
Initilaze the working directory
Init terraform before running the below shell script.
This action will download in your local directory all the required teffarorm providers or modules.
terraform init
Ubuntu 24.04 Image
Before proceeding with creating the VMs, we need to ensure that the Ubuntu 24.04 image is available on our system, or modify the code to download it from the internet.
In Variables.tf terraform file, you will notice the below entries
# The image source of the VM
# cloud_image = "https://cloud-images.ubuntu.com/oracular/current/focal-server-cloudimg-amd64.img"
cloud_image = "../oracular-server-cloudimg-amd64.img"
If you do not want to download the Ubuntu 24.04 cloud server image then make the below change
# The image source of the VM
cloud_image = "https://cloud-images.ubuntu.com/oracular/current/focal-server-cloudimg-amd64.img"
# cloud_image = "../oracular-server-cloudimg-amd64.img"
otherwise you need to download it, in the upper directory, to speed things up
cd ../
IMAGE="oracular" # 24.04
curl -sLO https://cloud-images.ubuntu.com/${IMAGE}/current/${IMAGE}-server-cloudimg-amd64.img
cd -

ls -l ../oracular-server-cloudimg-amd64.img
Spawn the VMs
We are ready to spawn our 3 VMs by running terraform plan & terraform apply
./start.sh
output should be something like:
...
Apply complete! Resources: 16 added, 0 changed, 0 destroyed.

Outputs:

VMs = [
  "192.168.122.223 k8scpnode1",
  "192.168.122.50  k8swrknode1",
  "192.168.122.10  k8swrknode2",
]
Verify that you have ssh access to the VMs
eg.
ssh ubuntu@192.168.122.223
Replace the IP with the one provided in the output.
DISCLAIMER if something failed, destroy everything with ./destroy.sh to remove any garbages before run ./start.sh again!!
Control-Plane Node
Let’s now begin configuring the Kubernetes control-plane node.
Ports on the control-plane node
Kubernetes runs a few services that needs to be accessable from the worker nodes.
| Protocol | Direction | Port Range | Purpose | Used By |
|---|---|---|---|---|
| TCP | Inbound | 6443 | Kubernetes API server | All |
| TCP | Inbound | 2379-2380 | etcd server client API | kube-apiserver, etcd |
| TCP | Inbound | 10250 | Kubelet API | Self, Control plane |
| TCP | Inbound | 10259 | kube-scheduler | Self |
| TCP | Inbound | 10257 | kube-controller-manager | Self |
Although etcd ports are included in control plane section, you can also host your
own etcd cluster externally or on custom ports.
Firewall on the control-plane node
We need to open the necessary ports on the CP’s (control-plane node) firewall.
sudo ufw allow 6443/tcp
sudo ufw allow 2379:2380/tcp
sudo ufw allow 10250/tcp
sudo ufw allow 10259/tcp
sudo ufw allow 10257/tcp

# sudo ufw disable
sudo ufw status
the output should be
To                         Action      From
--                         ------      ----
22/tcp                     ALLOW       Anywhere
6443/tcp                   ALLOW       Anywhere
2379:2380/tcp              ALLOW       Anywhere
10250/tcp                  ALLOW       Anywhere
10259/tcp                  ALLOW       Anywhere
10257/tcp                  ALLOW       Anywhere
22/tcp (v6)                ALLOW       Anywhere (v6)
6443/tcp (v6)              ALLOW       Anywhere (v6)
2379:2380/tcp (v6)         ALLOW       Anywhere (v6)
10250/tcp (v6)             ALLOW       Anywhere (v6)
10259/tcp (v6)             ALLOW       Anywhere (v6)
10257/tcp (v6)             ALLOW       Anywhere (v6)
Hosts file in the control-plane node
We need to update the /etc/hosts with the internal IP and hostname.
This will help when it is time to join the worker nodes.
echo $(hostname -I) $(hostname) | sudo tee -a /etc/hosts
Just a reminder: we need to update the hosts file to all the VMs.
To include all the VMs’ IPs and hostnames.
If you already know them, then your /etc/hosts file should look like this:
192.168.122.223 k8scpnode1
192.168.122.50  k8swrknode1
192.168.122.10  k8swrknode2
replace the IPs to yours.
Updating your hosts file
if you already the IPs of your VMs, run the below script to ALL 3 VMs
sudo tee -a /etc/hosts <<EOF

192.168.122.223 k8scpnode1
192.168.122.50  k8swrknode1
192.168.122.10  k8swrknode2
EOF
No Swap on the control-plane node
Be sure that SWAP is disabled in all virtual machines!
sudo swapoff -a
and the fstab file should not have any swap entry.
The below command should return nothing.
sudo grep -i swap /etc/fstab
If not, edit the /etc/fstab and remove the swap entry.
If you follow my terraform k8s code example from the above github repo,
you will notice that there isn’t any swap entry in the cloud init (user-data) file.
Nevertheless it is always a good thing to douple check.
Kernel modules on the control-plane node
We need to load the below kernel modules on all k8s nodes, so k8s can create some network magic!
- overlay
- br_netfilter
Run the below bash snippet that will do that, and also will enable the forwarding features of the network.
sudo tee /etc/modules-load.d/kubernetes.conf <<EOF
overlay
br_netfilter
EOF

sudo modprobe overlay
sudo modprobe br_netfilter

sudo lsmod | grep netfilter

sudo tee /etc/sysctl.d/kubernetes.conf <<EOF
net.bridge.bridge-nf-call-ip6tables = 1
net.bridge.bridge-nf-call-iptables = 1
net.ipv4.ip_forward = 1
EOF

sudo sysctl --system
NeedRestart on the control-plane node
Before installing any software, we need to make a tiny change to needrestart program. This will help with the automation of installing packages and will stop asking -via dialog- if we would like to restart the services!
temporarily
export -p NEEDRESTART_MODE="a"
permanently
a more permanent way, is to update the configuration file
echo "$nrconf{restart} = 'a';" | sudo tee -a /etc/needrestart/needrestart.conf
Installing a Container Runtime on the control-plane node
It is time to choose which container runtime we are going to use on our k8s cluster. There are a few container runtimes for k8s and in the past docker were used to. Nowadays the most common runtime is the containerd that can also uses the cgroup v2 kernel features. There is also a docker-engine runtime via CRI. Read here for more details on the subject.
curl -sL https://download.docker.com/linux/ubuntu/gpg | sudo gpg --dearmor -o /etc/apt/trusted.gpg.d/docker-keyring.gpg

sudo apt-add-repository -y "deb https://download.docker.com/linux/ubuntu oracular stable"

sleep 3

sudo apt-get -y install containerd.io

containerd config default
 | sed 's/SystemdCgroup = false/SystemdCgroup = true/'
 | sudo tee /etc/containerd/config.toml

sudo systemctl restart containerd.service
You can find the containerd configuration file here:
/etc/containerd/config.toml
In earlier versions of ubuntu we should enable the systemd cgroup driver.
Recomendation from official documentation is:
It is best to use cgroup v2, use the systemd cgroup driver instead of cgroupfs.
Starting with v1.22 and later, when creating a cluster with kubeadm, if the user does not set the cgroupDriver field under KubeletConfiguration, kubeadm defaults it to systemd.
Installing kubeadm, kubelet and kubectl on the control-plane node
Install the kubernetes packages (kubedam, kubelet and kubectl) by first adding the k8s repository on our virtual machine. To speed up the next step, we will also download the configuration container images.
This guide is using kubeadm, so we need to check the latest version.
Kubernetes v1.31 is the latest version when this guide was written.
VERSION="1.31"

curl -fsSL https://pkgs.k8s.io/core:/stable:/v${VERSION}/deb/Release.key | sudo gpg --dearmor -o /etc/apt/keyrings/kubernetes-apt-keyring.gpg

# allow unprivileged APT programs to read this keyring
sudo chmod 0644 /etc/apt/keyrings/kubernetes-apt-keyring.gpg

# This overwrites any existing configuration in /etc/apt/sources.list.d/kubernetes.list
echo "deb [signed-by=/etc/apt/keyrings/kubernetes-apt-keyring.gpg] https://pkgs.k8s.io/core:/stable:/v${VERSION}/deb/ /" | sudo tee /etc/apt/sources.list.d/kubernetes.list

# helps tools such as command-not-found to work correctly
sudo chmod 0644 /etc/apt/sources.list.d/kubernetes.list

sleep 2

sudo apt-get update
sudo apt-get install -y kubelet kubeadm kubectl
Get kubernetes admin configuration images
Retrieve the Kubernetes admin configuration images.
sudo kubeadm config images pull
Initializing the control-plane node
We can now proceed with initializing the control-plane node for our Kubernetes cluster.
There are a few things we need to be careful about:
- We can specify the control-plane-endpoint if we are planning to have a high available k8s cluster. (we will skip this for now),
- Choose a Pod network add-on (next section) but be aware that CoreDNS (DNS and Service Discovery) will not run till then (later),
- define where is our container runtime socket (we will skip it)
- advertise the API server (we will skip it)
But we will define our Pod Network CIDR to the default value of the Pod network add-on so everything will go smoothly later on.
sudo kubeadm init --pod-network-cidr=10.244.0.0/16
Keep the output in a notepad.
Create user access config to the k8s control-plane node
Our k8s control-plane node is running, so we need to have credentials to access it.
The kubectl reads a configuration file (that has the token), so we copying this from k8s admin.
rm -rf $HOME/.kube
mkdir -p $HOME/.kube

sudo cp -i /etc/kubernetes/admin.conf $HOME/.kube/config

sudo chown $(id -u):$(id -g) $HOME/.kube/config

ls -la $HOME/.kube/config

echo 'alias k="kubectl"' | sudo tee -a /etc/bash.bashrc
source /etc/bash.bashrc
Verify the control-plane node
Verify that the kubernets is running.
That means we have a k8s cluster - but only the control-plane node is running.
kubectl cluster-info
# kubectl cluster-info dump

kubectl get nodes   -o wide
kubectl get pods -A -o wide
Install an overlay network provider on the control-plane node
As I mentioned above, in order to use the DNS and Service Discovery services in the kubernetes (CoreDNS) we need to install a Container Network Interface (CNI) based Pod network add-on so that your Pods can communicate with each other.
Kubernetes Flannel is a popular network overlay solution for Kubernetes clusters, primarily used to enable networking between pods across different nodes. It’s a simple and easy-to-implement network fabric that uses the VXLAN protocol to create a flat virtual network, allowing Kubernetes pods to communicate with each other across different hosts.
Make sure to open the below udp ports for flannel’s VXLAN traffic (if you are going to use it):
sudo ufw allow 8472/udp
To install Flannel as the networking solution for your Kubernetes (K8s) cluster, run the following command to deploy Flannel:
k apply -f https://raw.githubusercontent.com/flannel-io/flannel/master/Documentation/kube-flannel.yml
Verify CoreDNS is running on the control-plane node
Verify that the control-plane node is Up & Running and the control-plane pods (as coredns pods) are also running
k get nodes -o wide
NAME        STATUS  ROLES          AGE  VERSION  INTERNAL-IP      EXTERNAL-IP  OS-IMAGE      KERNEL-VERSION    CONTAINER-RUNTIME
k8scpnode1  Ready   control-plane  12m  v1.31.3  192.168.122.223  <none>       Ubuntu 24.10  6.11.0-9-generic  containerd://1.7.23
k get pods -A -o wide
NAMESPACE     NAME                                READY  STATUS   RESTARTS  AGE    IP               NODE        NOMINATED NODE  READINESS GATES
kube-flannel  kube-flannel-ds-9v8fq               1/1    Running  0         2m17s  192.168.122.223  k8scpnode1  <none>          <none>
kube-system   coredns-7c65d6cfc9-dg6nq            1/1    Running  0         12m    10.244.0.2       k8scpnode1  <none>          <none>
kube-system   coredns-7c65d6cfc9-r4ksc            1/1    Running  0         12m    10.244.0.3       k8scpnode1  <none>          <none>
kube-system   etcd-k8scpnode1                     1/1    Running  0         13m    192.168.122.223  k8scpnode1  <none>          <none>
kube-system   kube-apiserver-k8scpnode1           1/1    Running  0         12m    192.168.122.223  k8scpnode1  <none>          <none>
kube-system   kube-controller-manager-k8scpnode1  1/1    Running  0         12m    192.168.122.223  k8scpnode1  <none>          <none>
kube-system   kube-proxy-sxtk9                    1/1    Running  0         12m    192.168.122.223  k8scpnode1  <none>          <none>
kube-system   kube-scheduler-k8scpnode1           1/1    Running  0         13m    192.168.122.223  k8scpnode1  <none>          <none>
That’s it with the control-plane node !
Worker Nodes
The following instructions apply similarly to both worker nodes. I will document the steps for the k8swrknode1 node, but please follow the same process for the k8swrknode2 node.
Ports on the worker nodes
As we learned above on the control-plane section, kubernetes runs a few services
| Protocol | Direction | Port Range | Purpose | Used By |
|---|---|---|---|---|
| TCP | Inbound | 10250 | Kubelet API | Self, Control plane |
| TCP | Inbound | 10256 | kube-proxy | Self, Load balancers |
| TCP | Inbound | 30000-32767 | NodePort Services | All |
Firewall on the worker nodes
so we need to open the necessary ports on the worker nodes too.
sudo ufw allow 10250/tcp
sudo ufw allow 10256/tcp
sudo ufw allow 30000:32767/tcp

sudo ufw status
The output should appear as follows:
To                         Action      From
--                         ------      ----
22/tcp                     ALLOW       Anywhere
10250/tcp                  ALLOW       Anywhere
30000:32767/tcp            ALLOW       Anywhere
22/tcp (v6)                ALLOW       Anywhere (v6)
10250/tcp (v6)             ALLOW       Anywhere (v6)
30000:32767/tcp (v6)       ALLOW       Anywhere (v6)
and do not forget, we also need to open UDP 8472 for flannel
sudo ufw allow 8472/udp
The next few steps are pretty much exactly the same as in the control-plane node.
In order to keep this documentation short, I’ll just copy/paste the commands.
Hosts file in the worker node
Update the /etc/hosts file to include the IPs and hostname of all VMs.
192.168.122.223 k8scpnode1
192.168.122.50  k8swrknode1
192.168.122.10  k8swrknode2
No Swap on the worker node
sudo swapoff -a
Kernel modules on the worker node
sudo tee /etc/modules-load.d/kubernetes.conf <<EOF
overlay
br_netfilter
EOF

sudo modprobe overlay
sudo modprobe br_netfilter

sudo lsmod | grep netfilter

sudo tee /etc/sysctl.d/kubernetes.conf <<EOF
net.bridge.bridge-nf-call-ip6tables = 1
net.bridge.bridge-nf-call-iptables = 1
net.ipv4.ip_forward = 1
EOF

sudo sysctl --system
NeedRestart on the worker node
export -p NEEDRESTART_MODE="a"
Installing a Container Runtime on the worker node
curl -sL https://download.docker.com/linux/ubuntu/gpg | sudo gpg --dearmor -o /etc/apt/trusted.gpg.d/docker-keyring.gpg

sudo apt-add-repository -y "deb https://download.docker.com/linux/ubuntu oracular stable"

sleep 3

sudo apt-get -y install containerd.io

containerd config default
 | sed 's/SystemdCgroup = false/SystemdCgroup = true/'
 | sudo tee /etc/containerd/config.toml

sudo systemctl restart containerd.service
Installing kubeadm, kubelet and kubectl on the worker node
VERSION="1.31"

curl -fsSL https://pkgs.k8s.io/core:/stable:/v${VERSION}/deb/Release.key | sudo gpg --dearmor -o /etc/apt/keyrings/kubernetes-apt-keyring.gpg

# allow unprivileged APT programs to read this keyring
sudo chmod 0644 /etc/apt/keyrings/kubernetes-apt-keyring.gpg

# This overwrites any existing configuration in /etc/apt/sources.list.d/kubernetes.list
echo "deb [signed-by=/etc/apt/keyrings/kubernetes-apt-keyring.gpg] https://pkgs.k8s.io/core:/stable:/v${VERSION}/deb/ /" | sudo tee /etc/apt/sources.list.d/kubernetes.list

# helps tools such as command-not-found to work correctly
sudo chmod 0644 /etc/apt/sources.list.d/kubernetes.list

sleep 3

sudo apt-get update
sudo apt-get install -y kubelet kubeadm kubectl
Get Token from the control-plane node
To join nodes to the kubernetes cluster, we need to have a couple of things.
- a token from control-plane node
- the CA certificate hash from the contol-plane node.
If you didnt keep the output the initialization of the control-plane node, that’s okay.
Run the below command in the control-plane node.
sudo kubeadm token list
and we will get the initial token that expires after 24hours.
TOKEN                    TTL  EXPIRES               USAGES                  DESCRIPTION                                               EXTRA GROUPS
7n4iwm.8xqwfcu4i1co8nof  23h  2024-11-26T12:14:55Z  authentication,signing  The default bootstrap token generated by 'kubeadm init'.  system:bootstrappers:kubeadm:default-node-token
In this case is the
7n4iwm.8xqwfcu4i1co8nofGet Certificate Hash from the control-plane node
To get the CA certificate hash from the control-plane-node, we need to run a complicated command:
openssl x509 -pubkey -in /etc/kubernetes/pki/ca.crt | openssl rsa -pubin -outform der 2>/dev/null | openssl dgst -sha256 -hex | sed 's/^.* //'
and in my k8s cluster is:
2f68e4b27cae2d2a6431f3da308a691d00d9ef3baa4677249e43b3100d783061Join Workers to the kubernetes cluster
So now, we can Join our worker nodes to the kubernetes cluster.
Run the below command on both worker nodes:
sudo kubeadm join 192.168.122.223:6443
        --token 7n4iwm.8xqwfcu4i1co8nof
        --discovery-token-ca-cert-hash sha256:2f68e4b27cae2d2a6431f3da308a691d00d9ef3baa4677249e43b3100d783061
we get this message
Run ‘kubectl get nodes’ on the control-plane to see this node join the cluster.
Is the kubernetes cluster running ?
We can verify that
kubectl get nodes   -o wide
kubectl get pods -A -o wide
All nodes have successfully joined the Kubernetes cluster
so make sure they are in Ready status.
k8scpnode1   Ready  control-plane  58m    v1.31.3  192.168.122.223  <none>  Ubuntu 24.10  6.11.0-9-generic  containerd://1.7.23
k8swrknode1  Ready  <none>         3m37s  v1.31.3  192.168.122.50   <none>  Ubuntu 24.10  6.11.0-9-generic  containerd://1.7.23
k8swrknode2  Ready  <none>         3m37s  v1.31.3  192.168.122.10   <none>  Ubuntu 24.10  6.11.0-9-generic  containerd://1.7.23
All pods
so make sure all pods are in Running status.
NAMESPACE     NAME                                READY  STATUS   RESTARTS  AGE    IP               NODE         NOMINATED NODE  READINESS GATES
kube-flannel  kube-flannel-ds-9v8fq               1/1    Running  0         46m    192.168.122.223  k8scpnode1   <none>          <none>
kube-flannel  kube-flannel-ds-hmtmv               1/1    Running  0         3m32s  192.168.122.50   k8swrknode1  <none>          <none>
kube-flannel  kube-flannel-ds-rwkrm               1/1    Running  0         3m33s  192.168.122.10   k8swrknode2  <none>          <none>
kube-system   coredns-7c65d6cfc9-dg6nq            1/1    Running  0         57m    10.244.0.2       k8scpnode1   <none>          <none>
kube-system   coredns-7c65d6cfc9-r4ksc            1/1    Running  0         57m    10.244.0.3       k8scpnode1   <none>          <none>
kube-system   etcd-k8scpnode1                     1/1    Running  0         57m    192.168.122.223  k8scpnode1   <none>          <none>
kube-system   kube-apiserver-k8scpnode1           1/1    Running  0         57m    192.168.122.223  k8scpnode1   <none>          <none>
kube-system   kube-controller-manager-k8scpnode1  1/1    Running  0         57m    192.168.122.223  k8scpnode1   <none>          <none>
kube-system   kube-proxy-49f6q                    1/1    Running  0         3m32s  192.168.122.50   k8swrknode1  <none>          <none>
kube-system   kube-proxy-6qpph                    1/1    Running  0         3m33s  192.168.122.10   k8swrknode2  <none>          <none>
kube-system   kube-proxy-sxtk9                    1/1    Running  0         57m    192.168.122.223  k8scpnode1   <none>          <none>
kube-system   kube-scheduler-k8scpnode1           1/1    Running  0         57m    192.168.122.223  k8scpnode1   <none>          <none>
That’s it !
Our k8s cluster is running.
Kubernetes Dashboard
is a general purpose, web-based UI for Kubernetes clusters. It allows users to manage applications running in the cluster and troubleshoot them, as well as manage the cluster itself.
Next, we can move forward with installing the Kubernetes dashboard on our cluster.
Helm
Helm—a package manager for Kubernetes that simplifies the process of deploying applications to a Kubernetes cluster. As of version 7.0.0, kubernetes-dashboard has dropped support for Manifest-based installation. Only Helm-based installation is supported now.
Live on the edge !
curl -sL https://raw.githubusercontent.com/helm/helm/main/scripts/get-helm-3 | bash
Install kubernetes dashboard
We need to add the kubernetes-dashboard helm repository first and install the helm chart after:
# Add kubernetes-dashboard repository
helm repo add kubernetes-dashboard https://kubernetes.github.io/dashboard/

# Deploy a Helm Release named "kubernetes-dashboard" using the kubernetes-dashboard chart
helm upgrade --install kubernetes-dashboard kubernetes-dashboard/kubernetes-dashboard --create-namespace --namespace kubernetes-dashboard
The output of the command above should resemble something like this:
Release "kubernetes-dashboard" does not exist. Installing it now.

NAME: kubernetes-dashboard
LAST DEPLOYED: Mon Nov 25 15:36:51 2024
NAMESPACE: kubernetes-dashboard
STATUS: deployed
REVISION: 1
TEST SUITE: None

NOTES:
*************************************************************************************************
*** PLEASE BE PATIENT: Kubernetes Dashboard may need a few minutes to get up and become ready ***
*************************************************************************************************

Congratulations! You have just installed Kubernetes Dashboard in your cluster.

To access Dashboard run:
  kubectl -n kubernetes-dashboard port-forward svc/kubernetes-dashboard-kong-proxy 8443:443

NOTE: In case port-forward command does not work, make sure that kong service name is correct.
      Check the services in Kubernetes Dashboard namespace using:
        kubectl -n kubernetes-dashboard get svc

Dashboard will be available at:
  https://localhost:8443
Verify the installation
kubectl -n kubernetes-dashboard get svc
NAME                                   TYPE        CLUSTER-IP       EXTERNAL-IP   PORT(S)    AGE
kubernetes-dashboard-api               ClusterIP   10.106.254.153   <none>        8000/TCP   3m48s
kubernetes-dashboard-auth              ClusterIP   10.103.156.167   <none>        8000/TCP   3m48s
kubernetes-dashboard-kong-proxy        ClusterIP   10.105.230.13    <none>        443/TCP    3m48s
kubernetes-dashboard-metrics-scraper   ClusterIP   10.109.7.234     <none>        8000/TCP   3m48s
kubernetes-dashboard-web               ClusterIP   10.106.125.65    <none>        8000/TCP   3m48s
kubectl get all -n kubernetes-dashboard
NAME                                                       READY   STATUS    RESTARTS   AGE
pod/kubernetes-dashboard-api-6dbb79747-rbtlc               1/1     Running   0          4m5s
pod/kubernetes-dashboard-auth-55d7cc5fbd-xccft             1/1     Running   0          4m5s
pod/kubernetes-dashboard-kong-57d45c4f69-t9lw2             1/1     Running   0          4m5s
pod/kubernetes-dashboard-metrics-scraper-df869c886-lt624   1/1     Running   0          4m5s
pod/kubernetes-dashboard-web-6ccf8d967-9rp8n               1/1     Running   0          4m5s

NAME                                           TYPE        CLUSTER-IP       EXTERNAL-IP   PORT(S)    AGE
service/kubernetes-dashboard-api               ClusterIP   10.106.254.153   <none>        8000/TCP   4m10s
service/kubernetes-dashboard-auth              ClusterIP   10.103.156.167   <none>        8000/TCP   4m10s
service/kubernetes-dashboard-kong-proxy        ClusterIP   10.105.230.13    <none>        443/TCP    4m10s
service/kubernetes-dashboard-metrics-scraper   ClusterIP   10.109.7.234     <none>        8000/TCP   4m10s
service/kubernetes-dashboard-web               ClusterIP   10.106.125.65    <none>        8000/TCP   4m10s

NAME                                                   READY   UP-TO-DATE   AVAILABLE   AGE
deployment.apps/kubernetes-dashboard-api               1/1     1            1           4m7s
deployment.apps/kubernetes-dashboard-auth              1/1     1            1           4m7s
deployment.apps/kubernetes-dashboard-kong              1/1     1            1           4m7s
deployment.apps/kubernetes-dashboard-metrics-scraper   1/1     1            1           4m7s
deployment.apps/kubernetes-dashboard-web               1/1     1            1           4m7s

NAME                                                             DESIRED   CURRENT   READY   AGE
replicaset.apps/kubernetes-dashboard-api-6dbb79747               1         1         1       4m6s
replicaset.apps/kubernetes-dashboard-auth-55d7cc5fbd             1         1         1       4m6s
replicaset.apps/kubernetes-dashboard-kong-57d45c4f69             1         1         1       4m6s
replicaset.apps/kubernetes-dashboard-metrics-scraper-df869c886   1         1         1       4m6s
replicaset.apps/kubernetes-dashboard-web-6ccf8d967               1         1         1       4m6s
Accessing Dashboard via a NodePort
A NodePort is a type of Service in Kubernetes that exposes a service on each node’s IP at a static port. This allows external traffic to reach the service by accessing the node’s IP and port. kubernetes-dashboard by default runs on a internal 10.x.x.x IP. To access the dashboard we need to have a NodePort in the kubernetes-dashboard service.
We can either Patch the service or edit the yaml file.
Choose one of the two options below; there’s no need to run both as it’s unnecessary (but not harmful).
Patch kubernetes-dashboard
This is one way to add a NodePort.
kubectl --namespace kubernetes-dashboard patch svc kubernetes-dashboard-kong-proxy -p '{"spec": {"type": "NodePort"}}'output
service/kubernetes-dashboard-kong-proxy patchedverify the service
kubectl get svc -n kubernetes-dashboardoutput
NAME                                   TYPE        CLUSTER-IP       EXTERNAL-IP   PORT(S)         AGE
kubernetes-dashboard-api               ClusterIP   10.106.254.153   <none>        8000/TCP        50m
kubernetes-dashboard-auth              ClusterIP   10.103.156.167   <none>        8000/TCP        50m
kubernetes-dashboard-kong-proxy        NodePort    10.105.230.13    <none>        443:32116/TCP   50m
kubernetes-dashboard-metrics-scraper   ClusterIP   10.109.7.234     <none>        8000/TCP        50m
kubernetes-dashboard-web               ClusterIP   10.106.125.65    <none>        8000/TCP        50m
we can see the 32116 in the kubernetes-dashboard.
Edit kubernetes-dashboard Service
This is an alternative way to add a NodePort.
kubectl edit svc -n kubernetes-dashboard kubernetes-dashboard-kong-proxy
and chaning the service type from
type: ClusterIPto
type: NodePortAccessing Kubernetes Dashboard
The kubernetes-dashboard has two (2) pods, one (1) for metrics, one (2) for the dashboard.
To access the dashboard, first we need to identify in which Node is running.
kubectl get pods -n kubernetes-dashboard -o wide
NAME                                                   READY   STATUS    RESTARTS   AGE    IP            NODE          NOMINATED NODE   READINESS GATES
kubernetes-dashboard-api-56f6f4b478-p4xbj              1/1     Running   0          55m   10.244.2.12   k8swrknode1   <none>           <none>
kubernetes-dashboard-auth-565b88d5f9-fscj9             1/1     Running   0          55m   10.244.1.12   k8swrknode2   <none>           <none>
kubernetes-dashboard-kong-57d45c4f69-rts57             1/1     Running   0          55m   10.244.2.10   k8swrknode1   <none>           <none>
kubernetes-dashboard-metrics-scraper-df869c886-bljqr   1/1     Running   0          55m   10.244.2.11   k8swrknode1   <none>           <none>
kubernetes-dashboard-web-6ccf8d967-t6k28               1/1     Running   0          55m   10.244.1.11   k8swrknode2   <none>           <none>
In my setup the dashboard pod is running on the worker node 1 and from the /etc/hosts is on the 192.168.122.50 IP.
The NodePort is 32116
k get svc -n kubernetes-dashboard -o wide
So, we can open a new tab on our browser and type:
https://192.168.122.50:32116and accept the self-signed certificate!
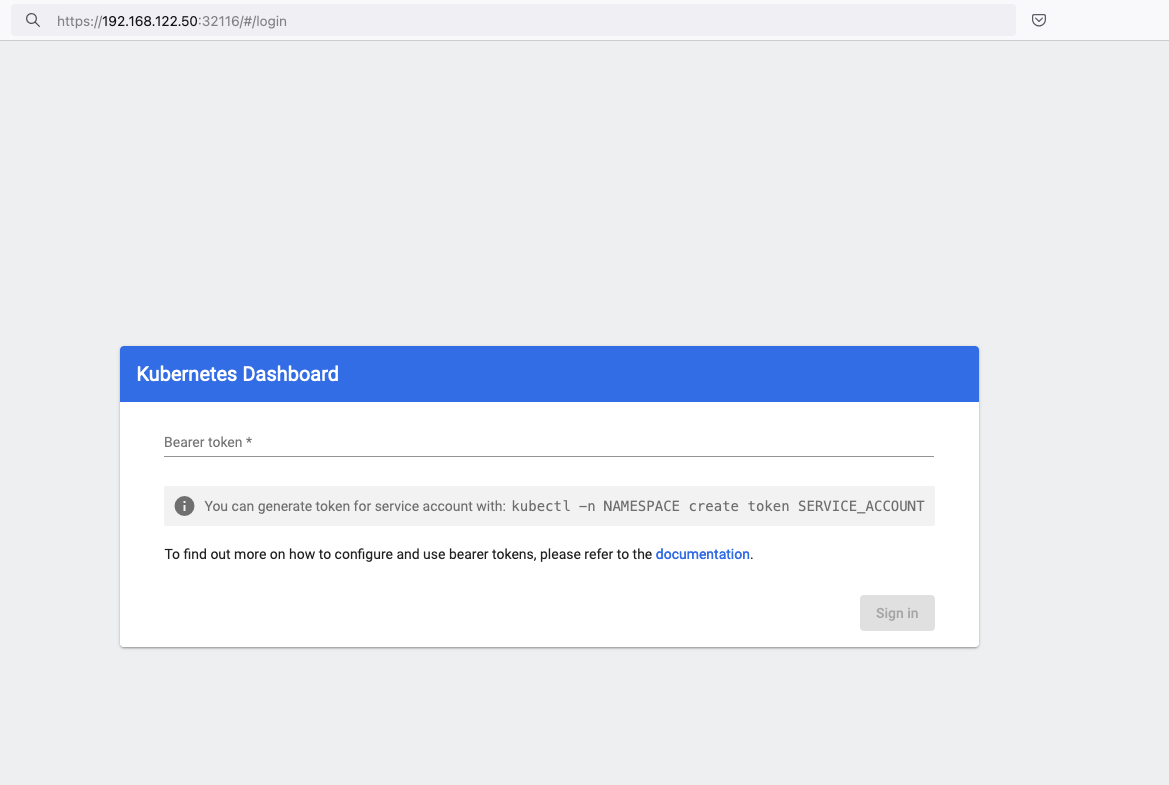
Create An Authentication Token (RBAC)
Last step for the kubernetes-dashboard is to create an authentication token.
Creating a Service Account
Create a new yaml file, with kind: ServiceAccount that has access to kubernetes-dashboard namespace and has name: admin-user.
cat > kubernetes-dashboard.ServiceAccount.yaml <<EOF
apiVersion: v1
kind: ServiceAccount
metadata:
  name: admin-user
  namespace: kubernetes-dashboard

EOF
add this service account to the k8s cluster
kubectl apply -f kubernetes-dashboard.ServiceAccount.yaml
output
serviceaccount/admin-user createdCreating a ClusterRoleBinding
We need to bind the Service Account with the kubernetes-dashboard via Role-based access control.
cat > kubernetes-dashboard.ClusterRoleBinding.yaml <<EOF
apiVersion: rbac.authorization.k8s.io/v1
kind: ClusterRoleBinding
metadata:
  name: admin-user
roleRef:
  apiGroup: rbac.authorization.k8s.io
  kind: ClusterRole
  name: cluster-admin
subjects:
- kind: ServiceAccount
  name: admin-user
  namespace: kubernetes-dashboard

EOF
apply this yaml file
kubectl apply -f kubernetes-dashboard.ClusterRoleBinding.yaml
clusterrolebinding.rbac.authorization.k8s.io/admin-user created
That means, our Service Account User has all the necessary roles to access the kubernetes-dashboard.
Getting a Bearer Token
Final step is to create/get a token for our user.
kubectl -n kubernetes-dashboard create token admin-user
eyJhbGciOiJSUzI1NiIsImtpZCI6IlpLbDVPVFQxZ1pTZlFKQlFJQkR6dVdGdGpvbER1YmVmVmlJTUd5WEVfdUEifQ.eyJhdWQiOlsiaHR0cHM6Ly9rdWJlcm5ldGVzLmRlZmF1bHQuc3ZjLmNsdXN0ZXIubG9jYWwiXSwiZXhwIjoxNzMyNzI0NTQ5LCJpYXQiOjE3MzI3MjA5NDksImlzcyI6Imh0dHBzOi8va3ViZXJuZXRlcy5kZWZhdWx0LnN2Yy5jbHVzdGVyLmxvY2FsIiwianRpIjoiMTczNzQyZGUtNDViZi00NjhkLTlhYWYtMDg3MDA3YmZmMjk3Iiwia3ViZXJuZXRlcy5pbyI6eyJuYW1lc3BhY2UiOiJrdWJlcm5ldGVzLWRhc2hib2FyZCIsInNlcnZpY2VhY2NvdW50Ijp7Im5hbWUiOiJhZG1pbi11c2VyIiwidWlkIjoiYWZhZmNhYzItZDYxNy00M2I0LTg2N2MtOTVkMzk5YmQ4ZjIzIn19LCJuYmYiOjE3MzI3MjA5NDksInN1YiI6InN5c3RlbTpzZXJ2aWNlYWNjb3VudDprdWJlcm5ldGVzLWRhc2hib2FyZDphZG1pbi11c2VyIn0.AlPSIrRsCW2vPa1P3aDQ21jaeIU2MAtiKcDO23zNRcd8-GbJUX_3oSInmSx9o2029eI5QxciwjduIRdJfTuhiPPypb3tp31bPT6Pk6_BgDuN7n4Ki9Y2vQypoXJcJNikjZpSUzQ9TOm88e612qfidSc88ATpfpS518IuXCswPg4WPjkI1WSPn-lpL6etrRNVfkT1eeSR0fO3SW3HIWQX9ce-64T0iwGIFjs0BmhDbBtEW7vH5h_hHYv3cbj_6yGj85Vnpjfcs9a9nXxgPrn_up7iA6lPtLMvQJ2_xvymc57aRweqsGSHjP2NWya9EF-KBy6bEOPB29LaIaKMywSuOQAdd this token to the previous login page
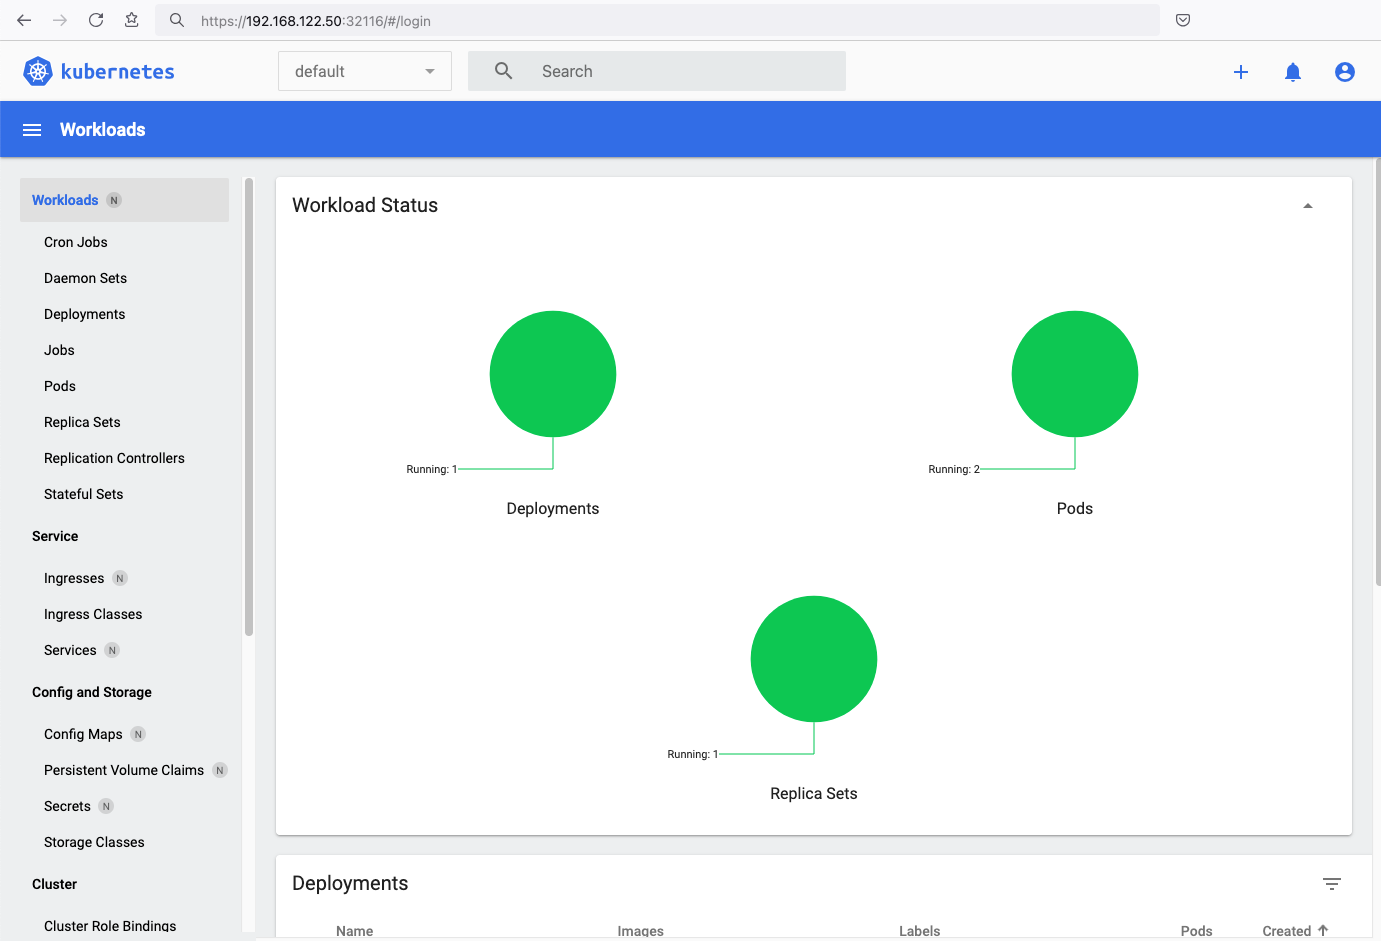
Browsing Kubernetes Dashboard
eg. Cluster –> Nodes
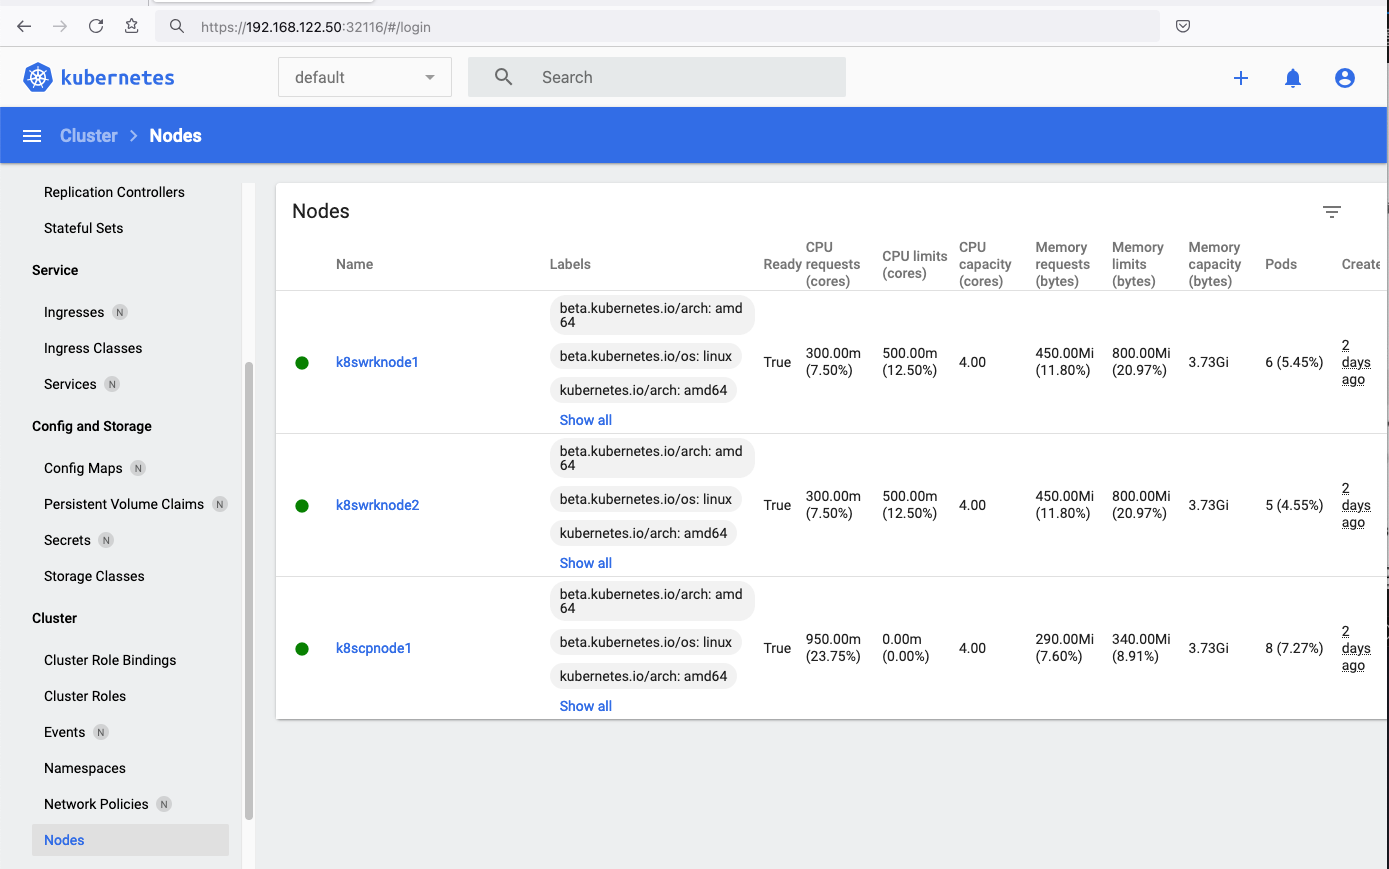
Nginx App
Before finishing this blog post, I would also like to share how to install a simple nginx-app as it is customary to do such thing in every new k8s cluster.
But plz excuse me, I will not get into much details.
You should be able to understand the below k8s commands.
Install nginx-app
kubectl create deployment nginx-app --image=nginx --replicas=2
deployment.apps/nginx-app createdGet Deployment
kubectl get deployment nginx-app -o wideNAME READY UP-TO-DATE AVAILABLE AGE CONTAINERS IMAGES SELECTOR
nginx-app 2/2 2 2 64s nginx nginx app=nginx-appExpose Nginx-App
kubectl expose deployment nginx-app --type=NodePort --port=80
service/nginx-app exposedVerify Service nginx-app
kubectl get svc nginx-app -o wide
NAME        TYPE       CLUSTER-IP      EXTERNAL-IP   PORT(S)        AGE   SELECTOR
nginx-app   NodePort   10.98.170.185   <none>        80:31761/TCP   27s   app=nginx-app
Describe Service nginx-app
kubectl describe svc nginx-app
Name:                     nginx-app
Namespace:                default
Labels:                   app=nginx-app
Annotations:              <none>
Selector:                 app=nginx-app
Type:                     NodePort
IP Family Policy:         SingleStack
IP Families:              IPv4
IP:                       10.98.170.185
IPs:                      10.98.170.185
Port:                     <unset>  80/TCP
TargetPort:               80/TCP
NodePort:                 <unset>  31761/TCP
Endpoints:                10.244.1.10:80,10.244.2.10:80
Session Affinity:         None
External Traffic Policy:  Cluster
Events:                   <none>
Curl Nginx-App
curl http://192.168.122.8:31761
<!DOCTYPE html>
<html>
<head>
<title>Welcome to nginx!</title>
<style>
html { color-scheme: light dark; }
body { width: 35em; margin: 0 auto;
font-family: Tahoma, Verdana, Arial, sans-serif; }
</style>
</head>
<body>
<h1>Welcome to nginx!</h1>
<p>If you see this page, the nginx web server is successfully installed and
working. Further configuration is required.</p>

<p>For online documentation and support please refer to
<a href="http://nginx.org/">nginx.org</a>.<br/>
Commercial support is available at
<a href="http://nginx.com/">nginx.com</a>.</p>

<p><em>Thank you for using nginx.</em></p>
</body>
</html>
Nginx-App from Browser
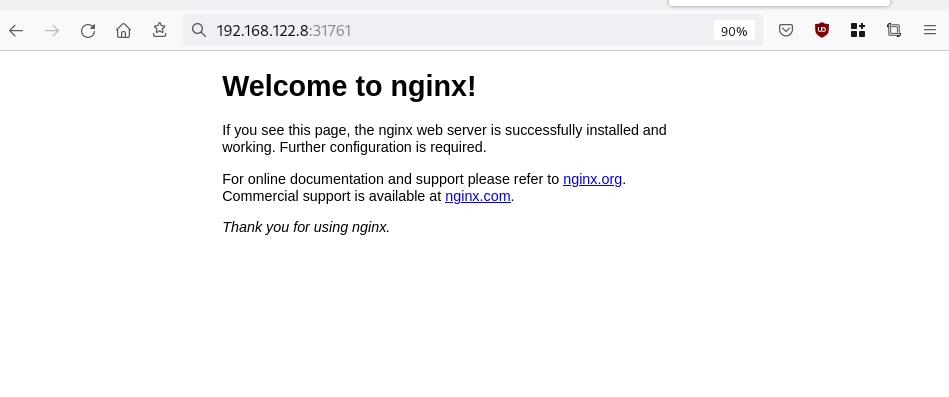
Change the default page
Last but not least, let’s modify the default index page to something different for educational purposes with the help of a ConfigMap
The idea is to create a ConfigMap with the html of our new index page then we would like to attach it to our nginx deployment as a volume mount !
cat > nginx_config.map << EOF
apiVersion: v1
data:
  index.html: |
    <!DOCTYPE html>
    <html lang="en">
    <head>
        <title>A simple HTML document</title>
    </head>
    <body>
        <p>Change the default nginx page </p>
    </body>
    </html>
kind: ConfigMap
metadata:
  name: nginx-config-page
  namespace: default
EOF
cat nginx_config.mapapiVersion: v1
data:
index.html: |
<!DOCTYPE html>
<html lang="en">
<head>
<title>A simple HTML document</title>
</head>
<body>
<p>Change the default nginx page </p>
</body>
</html>
kind: ConfigMap
metadata:
name: nginx-config-page
namespace: defaultapply the config.map
kubectl apply -f nginx_config.map
verify
kubectl get configmapNAME DATA AGE
kube-root-ca.crt 1 2d3h
nginx-config-page 1 16mnow the diffucult part, we need to mount our config map to the nginx deployment and to do that, we need to edit the nginx deployment.
kubectl edit deployments.apps nginx-apprewrite spec section to include:
- the VolumeMount &
- the ConfigMap as Volume
    spec:
      containers:
        - image: nginx
        ...
        volumeMounts:
        - mountPath: /usr/share/nginx/html
          name: nginx-config
    ...
      volumes:
      - configMap:
          name: nginx-config-page
        name: nginx-config
After saving, the nginx deployment will be updated by it-self.
finally we can see our updated first index page:
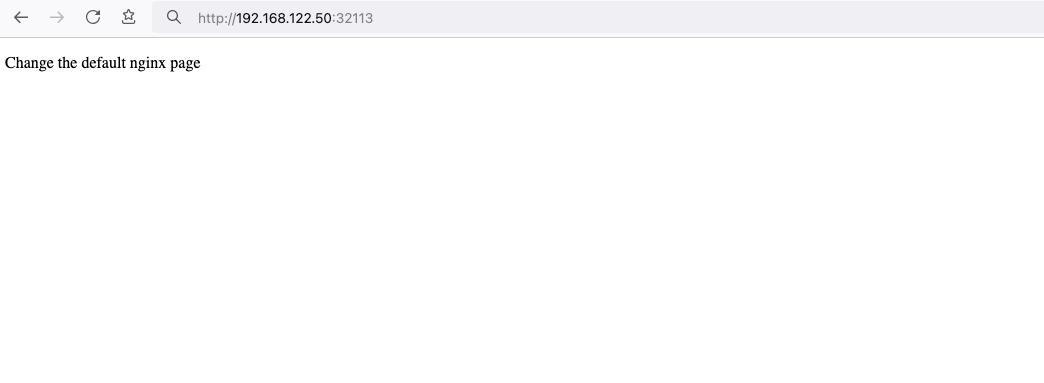
That’s it
I hope you enjoyed this post.
-Evaggelos Balaskas
destroy our lab
./destroy.sh...
libvirt_domain.domain-ubuntu["k8wrknode1"]: Destroying... [id=446cae2a-ce14-488f-b8e9-f44839091bce]
libvirt_domain.domain-ubuntu["k8scpnode"]: Destroying... [id=51e12abb-b14b-4ab8-b098-c1ce0b4073e3]
time_sleep.wait_for_cloud_init: Destroying... [id=2022-08-30T18:02:06Z]
libvirt_domain.domain-ubuntu["k8wrknode2"]: Destroying... [id=0767fb62-4600-4bc8-a94a-8e10c222b92e]
time_sleep.wait_for_cloud_init: Destruction complete after 0s
libvirt_domain.domain-ubuntu["k8wrknode1"]: Destruction complete after 1s
libvirt_domain.domain-ubuntu["k8scpnode"]: Destruction complete after 1s
libvirt_domain.domain-ubuntu["k8wrknode2"]: Destruction complete after 1s
libvirt_cloudinit_disk.cloud-init["k8wrknode1"]: Destroying... [id=/var/lib/libvirt/images/Jpw2Sg_cloud-init.iso;b8ddfa73-a770-46de-ad16-b0a5a08c8550]
libvirt_cloudinit_disk.cloud-init["k8wrknode2"]: Destroying... [id=/var/lib/libvirt/images/VdUklQ_cloud-init.iso;5511ed7f-a864-4d3f-985a-c4ac07eac233]
libvirt_volume.ubuntu-base["k8scpnode"]: Destroying... [id=/var/lib/libvirt/images/l5Rr1w_ubuntu-base]
libvirt_volume.ubuntu-base["k8wrknode2"]: Destroying... [id=/var/lib/libvirt/images/VdUklQ_ubuntu-base]
libvirt_cloudinit_disk.cloud-init["k8scpnode"]: Destroying... [id=/var/lib/libvirt/images/l5Rr1w_cloud-init.iso;11ef6bb7-a688-4c15-ae33-10690500705f]
libvirt_volume.ubuntu-base["k8wrknode1"]: Destroying... [id=/var/lib/libvirt/images/Jpw2Sg_ubuntu-base]
libvirt_cloudinit_disk.cloud-init["k8wrknode1"]: Destruction complete after 1s
libvirt_volume.ubuntu-base["k8wrknode2"]: Destruction complete after 1s
libvirt_cloudinit_disk.cloud-init["k8scpnode"]: Destruction complete after 1s
libvirt_cloudinit_disk.cloud-init["k8wrknode2"]: Destruction complete after 1s
libvirt_volume.ubuntu-base["k8wrknode1"]: Destruction complete after 1s
libvirt_volume.ubuntu-base["k8scpnode"]: Destruction complete after 2s
libvirt_volume.ubuntu-vol["k8wrknode1"]: Destroying... [id=/var/lib/libvirt/images/Jpw2Sg_ubuntu-vol]
libvirt_volume.ubuntu-vol["k8scpnode"]: Destroying... [id=/var/lib/libvirt/images/l5Rr1w_ubuntu-vol]
libvirt_volume.ubuntu-vol["k8wrknode2"]: Destroying... [id=/var/lib/libvirt/images/VdUklQ_ubuntu-vol]
libvirt_volume.ubuntu-vol["k8scpnode"]: Destruction complete after 0s
libvirt_volume.ubuntu-vol["k8wrknode2"]: Destruction complete after 0s
libvirt_volume.ubuntu-vol["k8wrknode1"]: Destruction complete after 0s
random_id.id["k8scpnode"]: Destroying... [id=l5Rr1w]
random_id.id["k8wrknode2"]: Destroying... [id=VdUklQ]
random_id.id["k8wrknode1"]: Destroying... [id=Jpw2Sg]
random_id.id["k8wrknode2"]: Destruction complete after 0s
random_id.id["k8scpnode"]: Destruction complete after 0s
random_id.id["k8wrknode1"]: Destruction complete after 0s
Destroy complete! Resources: 16 destroyed.
Personal notes on hardening an new ubuntu 24.04 LTS ssh daemon setup for incoming ssh traffic.
Port <12345>

PasswordAuthentication no
KbdInteractiveAuthentication no
UsePAM yes
X11Forwarding no
PrintMotd no
UseDNS no

KexAlgorithms sntrup761x25519-sha512@openssh.com,curve25519-sha256,curve25519-sha256@libssh.org,diffie-hellman-group-exchange-sha256,diffie-hellman-group16-sha512,diffie-hellman-group18-sha512,diffie-hellman-group14-sha256

HostKeyAlgorithms ssh-ed25519-cert-v01@openssh.com,ecdsa-sha2-nistp256-cert-v01@openssh.com,ecdsa-sha2-nistp384-cert-v01@openssh.com,ecdsa-sha2-nistp521-cert-v01@openssh.com,sk-ssh-ed25519-cert-v01@openssh.com,sk-ecdsa-sha2-nistp256-cert-v01@openssh.com,rsa-sha2-512-cert-v01@openssh.com,rsa-sha2-256-cert-v01@openssh.com,ssh-ed25519,ecdsa-sha2-nistp384,ecdsa-sha2-nistp521,sk-ssh-ed25519@openssh.com,sk-ecdsa-sha2-nistp256@openssh.com,rsa-sha2-512,rsa-sha2-256

MACs umac-128-etm@openssh.com,hmac-sha2-256-etm@openssh.com,hmac-sha2-512-etm@openssh.com,umac-128@openssh.com,hmac-sha2-256,hmac-sha2-512

AcceptEnv LANG LC_*
AllowUsers <username>

Subsystem       sftp    /usr/lib/openssh/sftp-server
testing with https://sshcheck.com/
Personal notes on hardening an new ubuntu 24.04 LTS postfix setup for incoming smtp TLS traffic.
Create a Diffie–Hellman key exchange
openssl dhparam -out /etc/postfix/dh2048.pem 2048for offering a new random DH group.
SMTPD - Incoming Traffic
# SMTPD - Incoming Traffic

postscreen_dnsbl_action = drop
postscreen_dnsbl_sites =
        bl.spamcop.net,
        zen.spamhaus.org

smtpd_banner = <put your banner here>

smtpd_helo_required = yes
smtpd_starttls_timeout = 30s

smtpd_tls_CApath = /etc/ssl/certs
smtpd_tls_cert_file = /root/.acme.sh/<your_domain>/fullchain.cer
smtpd_tls_key_file = /root/.acme.sh/<your_domain>/<your_domain>.key

smtpd_tls_dh1024_param_file = ${config_directory}/dh2048.pem
smtpd_tls_ciphers = HIGH

# Wick ciphers
smtpd_tls_exclude_ciphers =
        3DES,
        AES128-GCM-SHA256,
        AES128-SHA,
        AES128-SHA256,
        AES256-GCM-SHA384,
        AES256-SHA,
        AES256-SHA256,
        CAMELLIA128-SHA,
        CAMELLIA256-SHA,
        DES-CBC3-SHA,
        DHE-RSA-DES-CBC3-SHA,
        aNULL,
        eNULL,
        CBC

smtpd_tls_loglevel = 1
smtpd_tls_mandatory_ciphers = HIGH
smtpd_tls_protocols = !SSLv2, !SSLv3, !TLSv1, !TLSv1.1
smtpd_tls_security_level = may
smtpd_tls_session_cache_database = btree:${data_directory}/smtpd_scache
smtpd_use_tls = yes
tls_preempt_cipherlist = yes

unknown_local_recipient_reject_code = 550
Local Testing
testssl -t smtp <your_domain>.:25
Online Testing
result
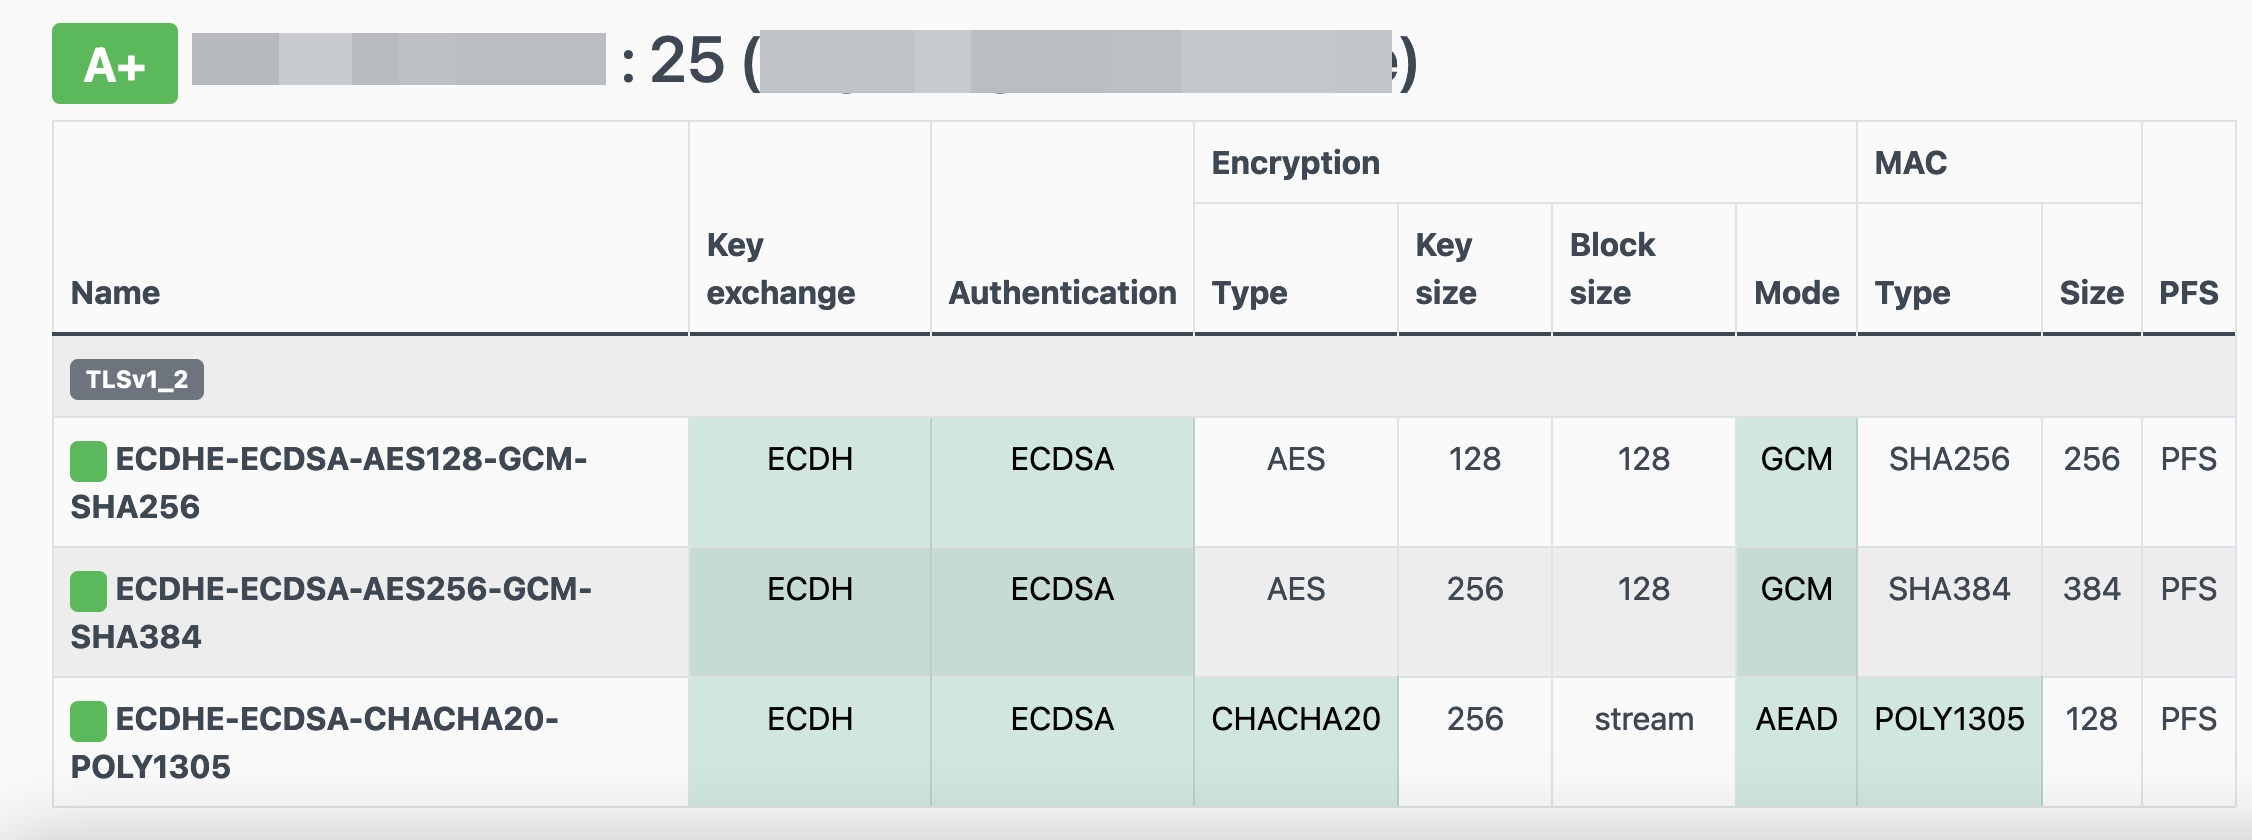
I have many random VPS and VMs across europe in different providers for reasons.
Two of them, are still running rpm based distro from 2011 and yes 13years later, I have not found the time to migrate them! Needless to say these are still my most stable running linux machines that I have, zero problems, ZERO PROBLEMS and are in production and heavily used every day. Let me write this again in bold: ZERO PROBLEMS.
But as time has come, I want to close some public services and use a mesh VPN for ssh. Tailscale entered the conversation and seems it’s binary works in new and old linux machines too.
long story short, I wanted an init script and with the debian package: dpkg, I could use start-stop-daemon.
Here is the init script:
#!/bin/bash

# ebal, Thu, 08 Aug 2024 14:18:11 +0300

### BEGIN INIT INFO
# Provides:          tailscaled
# Required-Start:    $local_fs $network $syslog
# Required-Stop:     $local_fs $network $syslog
# Default-Start:     2 3 4 5
# Default-Stop:      0 1 6
# Short-Description: tailscaled daemon
# Description:       tailscaled daemon
### END INIT INFO

. /etc/rc.d/init.d/functions

prog="tailscaled"
DAEMON="/usr/local/bin/tailscaled"
PIDFILE="/var/run/tailscaled.pid"

test -x $DAEMON || exit 0

case "$1" in
  start)
    echo "Starting ${prog} ..."
    start-stop-daemon --start --background --pidfile $PIDFILE --make-pidfile --startas $DAEMON --
    RETVAL=$?
    ;;
  stop)
    echo "Stopping ${prog} ..."
    if [ -f ${PIDFILE} ]; then
        start-stop-daemon --stop --pidfile $PIDFILE --retry 5 --startas ${DAEMON} -- -cleanup
        rm -f ${PIDFILE} > /dev/null 2>&1
    fi
    RETVAL=$?
    ;;
  status)
    start-stop-daemon --status --pidfile ${PIDFILE}
    status $prog
    RETVAL=$?
    ;;
  *)
    echo "Usage: /etc/init.d/tailscaled {start|stop|status}"
    RETVAL=1
    ;;
esac

exit ${RETVAL}
an example:
[root@kvm ~]# /etc/init.d/tailscaled start
Starting tailscaled ...

[root@kvm ~]# /etc/init.d/tailscaled status
tailscaled (pid  29101) is running...

[root@kvm ~]# find /var/ -type f -name "tailscale*pid"
/var/run/tailscaled.pid

[root@kvm ~]# cat /var/run/tailscaled.pid
29101

[root@kvm ~]# ps -e fuwww | grep -i tailscaled
root     29400  0.0  0.0 103320   880 pts/0    S+   16:49   0:00                      _ grep --color -i tailscaled
root     29101  2.0  0.7 1250440 32180 ?       Sl   16:48   0:00 /usr/local/bin/tailscaled

[root@kvm ~]# tailscale up

[root@kvm ~]# tailscale set -ssh

[root@kvm ~]# /etc/init.d/tailscaled stop
Stopping tailscaled ...

[root@kvm ~]# /etc/init.d/tailscaled status
tailscaled is stopped

[root@kvm ~]# /etc/init.d/tailscaled stop
Stopping tailscaled ...

[root@kvm ~]# /etc/init.d/tailscaled start
Starting tailscaled ...

[root@kvm ~]# /etc/init.d/tailscaled start
Starting tailscaled ...
process already running.

[root@kvm ~]# /etc/init.d/tailscaled status
tailscaled (pid  29552) is running...
Migrate legacy openldap to a docker container.
Prologue
I maintain a couple of legacy EOL CentOS 6.x SOHO servers to different locations. Stability on those systems is unparalleled and is -mainly- the reason of keeping them in production, as they run almost a decade without a major issue.
But I need to do a modernization of these legacy systems. So I must prepare a migration plan. Initial goal was to migrate everything to ansible roles. Although, I’ve walked down this path a few times in the past, the result is not something desirable. A plethora of configuration files and custom scripts. Not easily maintainable for future me.
Current goal is to setup a minimal setup for the underlying operating system, that I can easily upgrade through it’s LTS versions and separate the services from it. Keep the configuration on a git repository and deploy docker containers via docker-compose.
In this blog post, I will document the openldap service. I had some is issues against bitnami/openldap docker container so the post is also a kind of documentation.
Preparation
Two different cases, in one I have the initial ldif files (without the data) and on the second node I only have the data in ldifs but not the initial schema. So, I need to create for both locations a combined ldif that will contain the schema and data.
And that took me more time that it should! I could not get the service running correctly and I experimented with ldap exports till I found something that worked against bitnami/openldap notes and environment variables.
ldapsearch command
In /root/.ldap_conf I keep the environment variables as Base, Bind and Admin Password (only root user can read them).
cat /usr/local/bin/lds #!/bin/bash
source /root/.ldap_conf
/usr/bin/ldapsearch
-o ldif-wrap=no
-H ldap://$HOST
-D $BIND
-b $BASE
-LLL -x
-w $PASS $*
sudo lds > /root/openldap_export.ldif
Bitnami/openldap
GitHub page of bitnami/openldap has extensive documentation and a lot of environment variables you need to setup, to run an openldap service. Unfortunately, it took me quite a while, in order to find the proper configuration to import ldif from my current openldap service.
Through the years bitnami has made a few changes in libopenldap.sh which produced a frustrated period for me to review the shell script and understand what I need to do.
I would like to explain it in simplest terms here and hopefully someone will find it easier to migrate their openldap.
TL;DR
The correct way:
Create local directories
mkdir -pv {ldif,openldap}Place your openldap_export.ldif to the local ldif directory, and start openldap service with:
docker compose up---
services:
openldap:
image: bitnami/openldap:2.6
container_name: openldap
env_file:
- path: ./ldap.env
volumes:
- ./openldap:/bitnami/openldap
- ./ldifs:/ldifs
ports:
- 1389:1389
restart: always
volumes:
data:
driver: local
driver_opts:
device: /storage/docker
Your environmental configuration file, should look like:
cat ldap.env LDAP_ADMIN_USERNAME="admin"
LDAP_ADMIN_PASSWORD="testtest"
LDAP_ROOT="dc=example,dc=org"
LDAP_ADMIN_DN="cn=admin,$ LDAP_ROOT"
LDAP_SKIP_DEFAULT_TREE=yes
Below we are going to analyze and get into details of bitnami/openldap docker container and process.
OpenLDAP Version in docker container images.
Bitnami/openldap docker containers -at the time of writing- represent the below OpenLDAP versions:
bitnami/openldap:2    -> OpenLDAP: slapd 2.4.58
bitnami/openldap:2.5  -> OpenLDAP: slapd 2.5.17
bitnami/openldap:2.6  -> OpenLDAP: slapd 2.6.7
list images
docker images -a
REPOSITORY         TAG       IMAGE ID       CREATED        SIZE
bitnami/openldap   2.6       bf93eace348a   30 hours ago   160MB
bitnami/openldap   2.5       9128471b9c2c   2 days ago     160MB
bitnami/openldap   2         3c1b9242f419   2 years ago    151MB
Initial run without skipping default tree
As mentioned above the problem was with LDAP environment variables and LDAP_SKIP_DEFAULT_TREE was in the middle of those.
cat ldap.env LDAP_ADMIN_USERNAME="admin"
LDAP_ADMIN_PASSWORD="testtest"
LDAP_ROOT="dc=example,dc=org"
LDAP_ADMIN_DN="cn=admin,$ LDAP_ROOT"
LDAP_SKIP_DEFAULT_TREE=no
for testing: always empty ./openldap/ directory
docker compose up -dBy running ldapsearch (see above) the results are similar to below data
ldsdn: dc=example,dc=org
objectClass: dcObject
objectClass: organization
dc: example
o: example
dn: ou=users,dc=example,dc=org
objectClass: organizationalUnit
ou: users
dn: cn=user01,ou=users,dc=example,dc=org
cn: User1
cn: user01
sn: Bar1
objectClass: inetOrgPerson
objectClass: posixAccount
objectClass: shadowAccount
userPassword:: Yml0bmFtaTE=
uid: user01
uidNumber: 1000
gidNumber: 1000
homeDirectory: /home/user01
dn: cn=user02,ou=users,dc=example,dc=org
cn: User2
cn: user02
sn: Bar2
objectClass: inetOrgPerson
objectClass: posixAccount
objectClass: shadowAccount
userPassword:: Yml0bmFtaTI=
uid: user02
uidNumber: 1001
gidNumber: 1001
homeDirectory: /home/user02
dn: cn=readers,ou=users,dc=example,dc=org
cn: readers
objectClass: groupOfNames
member: cn=user01,ou=users,dc=example,dc=org
member: cn=user02,ou=users,dc=example,dc=org
so as you can see, they create some default users and groups.
Initial run with skipping default tree
Now, let’s skip creating the default users/groups.
cat ldap.env LDAP_ADMIN_USERNAME="admin"
LDAP_ADMIN_PASSWORD="testtest"
LDAP_ROOT="dc=example,dc=org"
LDAP_ADMIN_DN="cn=admin,$ LDAP_ROOT"
LDAP_SKIP_DEFAULT_TREE=yes
(always empty ./openldap/ directory )
docker compose up -dldapsearch now returns:
No such object (32)That puzzled me … a lot !
Conclusion
It does NOT matter if you place your ldif schema file and data and populate the LDAP variables with bitnami/openldap. Or use ANY other LDAP variable from bitnami/openldap reference manual.
The correct method is to SKIP default tree and place your export ldif to the local ldif directory. Nothing else worked.
Took me almost 4 days to figure it out and I had to read the libopenldap.sh.
That’s it !
Prologue
I have a Samsung QLED 55” Smart TV, I run ReadyMedia | MiniDLNA to stream my media from my desktop PC to the TV.
DLNA/ UPnP is a well implemented protocol, easy enough, but MiniDLNA has some limitations. There is not a UX environment, no tracking viewing history, thumbnails issues and a few other small things.
I was looking for an alternative solution for quite some time. and from time to time I got Jellyfin as a suggestion.
Jellyfin Server
I wanted to explore this possibility again, but without the hustle of installing dependencies etc, so the Docker options seemed the best.
docker pull jellyfin/jellyfinthis will download the Jellyfin latest container image.
after that I wrote a small shell script start.sh to start Jellyfin.
#!/bin/bash

# ebal, Sun, 25 Feb 2024 14:27:32 +0200
MyMEDIA="/opt/media"

cd /opt/jellyfin/
mkdir {config,cache}

docker run -d
    --name jellyfin
    -v "$PWD"/config:/config
    -v "$PWD"/cache:/cache
    -v "$MyMEDIA":/media
    --net=host
    jellyfin/jellyfin:latest
and by running this script will start Jellyfin.

Samsung TV
I was looking the Jellyfin clients and almost all of them are the same with the web client version, so it seemed over engineering to use something else. But how to install a Jellyfin client to my Samsung TV?
after browsing the web, I found that Samsung is running Tizen An open source, standards-based software platform for multiple device categories, which to be honest was one of the reasons I bought a Samsung TV in the first place but completely forgot and never used anything tizen related.
It was time to do something about it, so I had to put my TV into developer mode !!!
Apps type 12345 and you enable developer mode
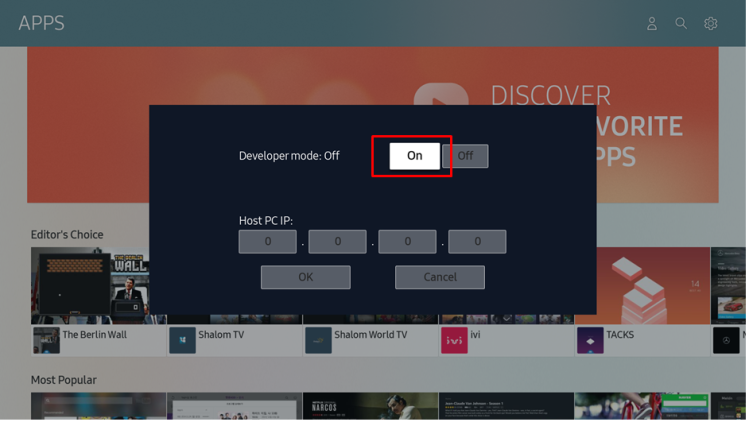
Enable On and this is important type your host IP address
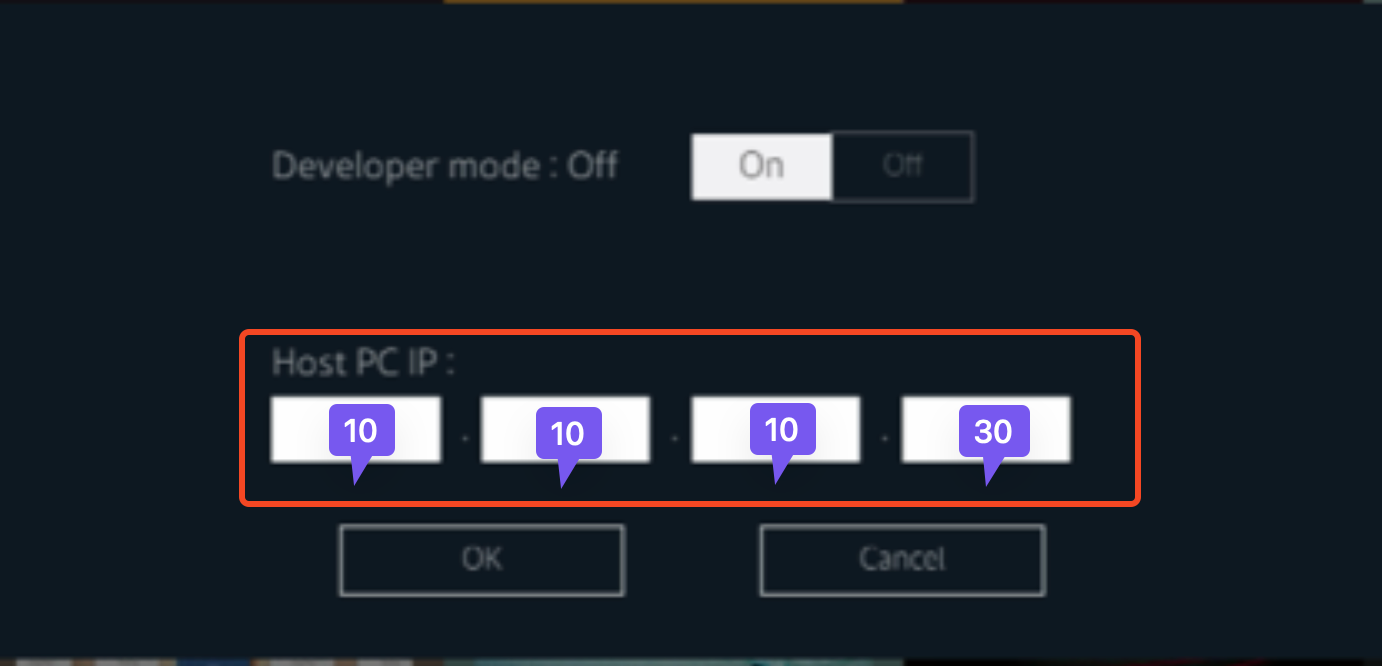
In this case, my host PC is 10.10.10.30.
Tizen and Jellyfin
There is a long story on how to setup Tizen Studio, built your Jellyfin binary and then upload it to your Samsung TV. But there is an easiest way to do via docker containers.
you need to find your TV’s IP and run the below command:
sudo docker run --ulimit nofile=122880:122880 -m 3G --rm georift/install-jellyfin-tizen <Samsung TV IP>
eg. my samsung tv is 10.10.10.39
sudo docker run --ulimit nofile=122880:122880 -m 3G --rm georift/install-jellyfin-tizen 10.10.10.39
This project will do two things:
- download the latest built of Jellyfin for tizen from here jeppevinkel/jellyfin-tizen-builds
- and then upload it via
tizen-clito the TV
Samsung TV


There are many articles on the web on how to migrate, backup or sync mailboxes with dovecot. Very useful when migrating from one server to another or converting from one type to another.
But there are none on how to copy some specific mailboxes from one account to another, on the same mail server !
That took me in a rabbit hole today, as I got this request from a client.
Prologue
There are many accounts on that dovecot/postfix mail server. We need to copy (not share) about 120 specific folders from a colleague that is many years on the company to a new colleague.
Dsync
The proper way to do that is via dovecot sync or dsync command for short. The main problem with that is the majority of articles and howtos and even man pages or about of syncing mailboxes from one server to another.
The solution actually is pretty much straight forward and simply but it wasnt till I made a few mistakes, so here is the correct way!
dsync -Dv -m "mailbox_name" -u "source_email_address" backup dsync -u "destination_email_address"- D is for debug
- v is for verbose
- m is for declaring the specific mailbox
- u is for the username/email address on the local server
We can use two verbs, backup and mirror. Backup is one way sync, Mirror is two way sync. I chose backup
Now the tricky part, here is the destination server and all the examples are mentioning a remote server. I wanted to transfer mailboxes on the same server and it took me more time that I would like to share with you to figure it out.
You just need to add the dsync command and the destination username/email address!
example:
dsync -Dv \
 -m 'INBOX.1_Folder1 Rare Diseases' -u FirstName1.Lastname1@example.com \
 backup \
 dsync -u FirstName2.Lastname2@example.com
Caveats
Without getting into much details, you should use latin1 characters and avoid special characters. I requested some renames from the origin user and after that everything went smoothly with the backup/sync.
Control/Index/Subscriptions
That was an issue. I did something wrong and I could not subscribe to any folders. I’ve tried a couple of hours to figure this out but in the end I removed the related control/index dovecot files from the destination user and restarted dovecot service.
It worked !
some commands
List all related folders/mailboxes under 1_company1
doveadm mailbox list -u FirstName1.Lastname1@example.com | grep -i 1_company1
oneliner
doveadm mailbox list -u FirstName1.Lastname1@example.com | grep -i 1_company1 | sort | grep -v Diseases | awk '{print "dsync -Dv -m \47"$0"\47 -u FirstName1.Lastname1@example.com backup dsync -u FirstName2.Lastname2@example.com}'
that’s it!
There is some confusion on which is the correct way to migrate your current/local docker images to another disk. To reduce this confusion, I will share my personal notes on the subject.
Prologue
I replaced a btrfs raid-1 1TB storage with another btrfs raid-1 4TB setup. So 2 disks out, 2 new disks in. I also use luks, so all my disks are encrypted with random 4k keys before btrfs on them. There is -for sure- a write-penalty with this setup, but I am for data resilience - not speed.
Before
These are my local docker images
docker images -a
REPOSITORY        TAG           IMAGE ID         CREATED      SIZE
golang            1.19          b47c7dfaaa93     5 days   ago   993MB
archlinux         base-devel    a37dc5345d16     6 days   ago   764MB
archlinux         base          d4e07600b346    4 weeks  ago   418MB
ubuntu            22.04         58db3edaf2be    2 months ago   77.8MB
centos7           ruby          28f8bde8a757    3 months ago   532MB
ubuntu            20.04         d5447fc01ae6    4 months ago   72.8MB
ruby              latest        046e6d725a3c    4 months ago   893MB
alpine            latest        49176f190c7e    4 months ago   7.04MB
bash              latest        018f8f38ad92    5 months ago   12.3MB
ubuntu            18.04         71eaf13299f4    5 months ago   63.1MB
centos            6             5bf9684f4720   19 months ago   194MB
centos            7             eeb6ee3f44bd   19 months ago   204MB
centos            8             5d0da3dc9764   19 months ago   231MB
ubuntu            16.04         b6f507652425   19 months ago   135MB
3bal/centos6-eol  devtoolset-7  ff3fa1a19332    2 years  ago   693MB
3bal/centos6-eol  latest        aa2256d57c69    2 years  ago   194MB
centos6           ebal          d073310c1ec4    2 years  ago   3.62GB
3bal/arch         devel         76a20143aac1    2 years  ago   1.02GB
cern/slc6-base    latest        63453d0a9b55    3 years  ago   222MB
Yes, I am still using centos6! It’s stable!!
docker save - docker load
Reading docker’s documentation, the suggested way is docker save and docker load. Seems easy enough:
docker save --output busybox.tar busybox
docker load < busybox.tar.gz
which is a lie!
docker prune
before we do anything with the docker images, let us clean up the garbages
sudo docker system prune
docker save - the wrong way
so I used the ImageID as a reference:
docker images -a | grep -v ^REPOSITORY | awk '{print "docker save -o "$3".tar "$3}'
piped out through a bash shell | bash -x
and got my images:
$ ls -1

33a093dd9250.tar
b47c7dfaaa93.tar
16eed3dc21a6.tar
d4e07600b346.tar
58db3edaf2be.tar
28f8bde8a757.tar
382715ecff56.tar
d5447fc01ae6.tar
046e6d725a3c.tar
49176f190c7e.tar
018f8f38ad92.tar
71eaf13299f4.tar
5bf9684f4720.tar
eeb6ee3f44bd.tar
5d0da3dc9764.tar
b6f507652425.tar
ff3fa1a19332.tar
aa2256d57c69.tar
d073310c1ec4.tar
76a20143aac1.tar
63453d0a9b55.tar
docker daemon
I had my docker images on tape-archive (tar) format. Now it was time to switch to my new btrfs storage. In order to do that, the safest way is my tweaking the
/etc/docker/daemon.json
and I added the data-root section
{
    "dns": ["8.8.8.8"],
    "data-root": "/mnt/WD40PURZ/var_lib_docker"
}
I will explain var_lib_docker in a bit, stay with me.
and restarted docker
sudo systemctl restart dockerdocker load - the wrong way
It was time to restore aka load the docker images back to docker
ls -1 | awk '{print "docker load --input "$1".tar"}'

docker load --input 33a093dd9250.tar
docker load --input b47c7dfaaa93.tar
docker load --input 16eed3dc21a6.tar
docker load --input d4e07600b346.tar
docker load --input 58db3edaf2be.tar
docker load --input 28f8bde8a757.tar
docker load --input 382715ecff56.tar
docker load --input d5447fc01ae6.tar
docker load --input 046e6d725a3c.tar
docker load --input 49176f190c7e.tar
docker load --input 018f8f38ad92.tar
docker load --input 71eaf13299f4.tar
docker load --input 5bf9684f4720.tar
docker load --input eeb6ee3f44bd.tar
docker load --input 5d0da3dc9764.tar
docker load --input b6f507652425.tar
docker load --input ff3fa1a19332.tar
docker load --input aa2256d57c69.tar
docker load --input d073310c1ec4.tar
docker load --input 76a20143aac1.tar
docker load --input 63453d0a9b55.tar
I was really happy, till I saw the result:
# docker images -a

REPOSITORY   TAG       IMAGE ID       CREATED         SIZE
<none>       <none>    b47c7dfaaa93   5 days ago      993MB
<none>       <none>    a37dc5345d16   6 days ago      764MB
<none>       <none>    16eed3dc21a6   2 weeks ago     65.5MB
<none>       <none>    d4e07600b346   4 weeks ago     418MB
<none>       <none>    58db3edaf2be   2 months ago    77.8MB
<none>       <none>    28f8bde8a757   3 months ago    532MB
<none>       <none>    382715ecff56   3 months ago    705MB
<none>       <none>    d5447fc01ae6   4 months ago    72.8MB
<none>       <none>    046e6d725a3c   4 months ago    893MB
<none>       <none>    49176f190c7e   4 months ago    7.04MB
<none>       <none>    018f8f38ad92   5 months ago    12.3MB
<none>       <none>    71eaf13299f4   5 months ago    63.1MB
<none>       <none>    5bf9684f4720   19 months ago   194MB
<none>       <none>    eeb6ee3f44bd   19 months ago   204MB
<none>       <none>    5d0da3dc9764   19 months ago   231MB
<none>       <none>    b6f507652425   19 months ago   135MB
<none>       <none>    ff3fa1a19332   2 years ago     693MB
<none>       <none>    aa2256d57c69   2 years ago     194MB
<none>       <none>    d073310c1ec4   2 years ago     3.62GB
<none>       <none>    76a20143aac1   2 years ago     1.02GB
<none>       <none>    63453d0a9b55   3 years ago     222MB
No REPOSITORY or TAG !
then after a few minutes of internet search, I’ve realized that if you use the ImageID as a reference point in docker save, you will not get these values !!!!
and there is no reference here: https://docs.docker.com/engine/reference/commandline/save/
Removed everything , removed the data-root from /etc/docker/daemon.json and started again from the beginning
docker save - the correct way
docker images -a | grep -v ^REPOSITORY | awk '{print "docker save -o "$3".tar "$1":"$2""}' | sh -xoutput:
+ docker save -o b47c7dfaaa93.tar golang:1.19
+ docker save -o a37dc5345d16.tar archlinux:base-devel
+ docker save -o d4e07600b346.tar archlinux:base
+ docker save -o 58db3edaf2be.tar ubuntu:22.04
+ docker save -o 28f8bde8a757.tar centos7:ruby
+ docker save -o 382715ecff56.tar gitlab/gitlab-runner:ubuntu
+ docker save -o d5447fc01ae6.tar ubuntu:20.04
+ docker save -o 046e6d725a3c.tar ruby:latest
+ docker save -o 49176f190c7e.tar alpine:latest
+ docker save -o 018f8f38ad92.tar bash:latest
+ docker save -o 71eaf13299f4.tar ubuntu:18.04
+ docker save -o 5bf9684f4720.tar centos:6
+ docker save -o eeb6ee3f44bd.tar centos:7
+ docker save -o 5d0da3dc9764.tar centos:8
+ docker save -o b6f507652425.tar ubuntu:16.04
+ docker save -o ff3fa1a19332.tar 3bal/centos6-eol:devtoolset-7
+ docker save -o aa2256d57c69.tar 3bal/centos6-eol:latest
+ docker save -o d073310c1ec4.tar centos6:ebal
+ docker save -o 76a20143aac1.tar 3bal/arch:devel
+ docker save -o 63453d0a9b55.tar cern/slc6-base:latest
docker daemon with new data point
{
    "dns": ["8.8.8.8"],
    "data-root": "/mnt/WD40PURZ/var_lib_docker"
}
restart docker
sudo systemctl restart dockerdocker load - the correct way
ls -1 | awk '{print "docker load --input "$1}'
and verify -moment of truth-
$ docker images -a
REPOSITORY        TAG           IMAGE         ID  CREATED  SIZE
archlinux         base-devel    33a093dd9250  3   days     ago   764MB
golang            1.19          b47c7dfaaa93  8   days     ago   993MB
archlinux         base          d4e07600b346  4   weeks    ago   418MB
ubuntu            22.04         58db3edaf2be  2   months   ago   77.8MB
centos7           ruby          28f8bde8a757  3   months   ago   532MB
gitlab/gitlab-runner ubuntu     382715ecff56  4   months   ago   705MB
ubuntu            20.04         d5447fc01ae6  4   months   ago   72.8MB
ruby              latest        046e6d725a3c  4   months   ago   893MB
alpine            latest        49176f190c7e  4   months   ago   7.04MB
bash              latest        018f8f38ad92  5   months   ago   12.3MB
ubuntu            18.04         71eaf13299f4  5   months   ago   63.1MB
centos            6             5bf9684f4720  19  months   ago   194MB
centos            7             eeb6ee3f44bd  19  months   ago   204MB
centos            8             5d0da3dc9764  19  months   ago   231MB
ubuntu            16.04         b6f507652425  19  months   ago   135MB
3bal/centos6-eol  devtoolset-7  ff3fa1a19332  2   years    ago   693MB
3bal/centos6-eol  latest        aa2256d57c69  2   years    ago   194MB
centos6           ebal          d073310c1ec4  2   years    ago   3.62GB
3bal/arch         devel         76a20143aac1  2   years    ago   1.02GB
cern/slc6-base    latest        63453d0a9b55  3   years    ago   222MB
success !
btrfs mount point
Now it is time to explain the var_lib_docker
but first , let’s verify ST1000DX002 mount point with WD40PURZ
$ sudo ls -l /mnt/ST1000DX002/var_lib_docker/

total 4
drwx--x--- 1 root root  20 Nov 24  2020 btrfs
drwx------ 1 root root  20 Nov 24  2020 builder
drwx--x--x 1 root root 154 Dec 18  2020 buildkit
drwx--x--x 1 root root  12 Dec 18  2020 containerd
drwx--x--- 1 root root   0 Apr 14 19:52 containers
-rw------- 1 root root  59 Feb 13 10:45 engine-id
drwx------ 1 root root  10 Nov 24  2020 image
drwxr-x--- 1 root root  10 Nov 24  2020 network
drwx------ 1 root root  20 Nov 24  2020 plugins
drwx------ 1 root root   0 Apr 18 18:19 runtimes
drwx------ 1 root root   0 Nov 24  2020 swarm
drwx------ 1 root root   0 Apr 18 18:32 tmp
drwx------ 1 root root   0 Nov 24  2020 trust
drwx-----x 1 root root 568 Apr 18 18:19 volumes
$ sudo ls -l /mnt/WD40PURZ/var_lib_docker/

total 4
drwx--x--- 1 root root  20 Apr 18 16:51 btrfs
drwxr-xr-x 1 root root  14 Apr 18 17:46 builder
drwxr-xr-x 1 root root 148 Apr 18 17:48 buildkit
drwxr-xr-x 1 root root  20 Apr 18 17:47 containerd
drwx--x--- 1 root root   0 Apr 14 19:52 containers
-rw------- 1 root root  59 Feb 13 10:45 engine-id
drwxr-xr-x 1 root root  20 Apr 18 17:48 image
drwxr-xr-x 1 root root  24 Apr 18 17:48 network
drwxr-xr-x 1 root root  34 Apr 18 17:48 plugins
drwx------ 1 root root   0 Apr 18 18:36 runtimes
drwx------ 1 root root   0 Nov 24  2020 swarm
drwx------ 1 root root  48 Apr 18 18:42 tmp
drwx------ 1 root root   0 Nov 24  2020 trust
drwx-----x 1 root root  70 Apr 18 18:36 volumes
var_lib_docker is actually a btrfs subvolume that we can mount it on our system
$ sudo btrfs subvolume show /mnt/WD40PURZ/var_lib_docker/

var_lib_docker
        Name:                   var_lib_docker
        UUID:                   5552de11-f37c-4143-855f-50d02f0a9836
        Parent UUID:            -
        Received UUID:          -
        Creation time:          2023-04-18 16:25:54 +0300
        Subvolume ID:           4774
        Generation:             219588
        Gen at creation:        215579
        Parent ID:              5
        Top level ID:           5
        Flags:                  -
        Send transid:           0
        Send time:              2023-04-18 16:25:54 +0300
        Receive transid:        0
        Receive time:           -
        Snapshot(s):
We can use the subvolume id for that:
mount -o subvolid=4774 LABEL="WD40PURZ" /var/lib/docker/
So /var/lib/docker/ path on our rootfs, is now a mount point for our BTRFS raid-1 4TB storage and we can remove the data-root declaration from /etc/docker/daemon.json and restart our docker service.
That’s it !
I’ve been using btrfs for a decade now (yes, than means 10y) on my setup (btw I use ArchLinux). I am using subvolumes and read-only snapshots with btrfs, but I have never created a script to automate my backups.
I KNOW, WHAT WAS I DOING ALL THESE YEARS!!A few days ago, a dear friend asked me something about btrfs snapshots, and that question gave me the nudge to think about my btrfs subvolume snapshots and more specific how to automate them. A day later, I wrote a simple (I think so) script to do automate my backups.
The script as a gist
The script is online as a gist here: BTRFS: Automatic Snapshots Script . In this blog post, I’ll try to describe the requirements and what is my thinking. I waited a couple weeks so the cron (or systemd timer) script run itself and verify that everything works fine. Seems that it does (at least for now) and the behaviour is as expected. I will keep a static copy of my script in this blog post but any future changes should be done in the above gist.
Improvements
The script can be improved by many,many ways (check available space before run, measure the time of running, remove sudo, check if root is running the script, verify the partitions are on btrfs, better debugging, better reporting, etc etc). These are some of the ways of improving the script, I am sure you can think a million more - feel free to sent me your proposals. If I see something I like, I will incorporate them and attribute of-course. But be reminded that I am not driven by smart code, I prefer to have clear and simple code, something that everybody can easily read and understand.
Mount Points
To be completely transparent, I encrypt all my disks (usually with a random keyfile). I use btrfs raid1 on the disks and create many subvolumes on them. Everything exists outside of my primary ssd rootfs disk. So I use a small but fast ssd for my operating system and btrfs-raid1 for my “spinning rust” disks.
BTRFS subvolumes can be mounted as normal partitions and that is exactly what I’ve done with my home and opt. I keep everything that I’ve install outside of my distribution under opt.
This setup is very flexible as I can easy replace the disks when the storage is full by removing one by one of the disks from btrfs-raid1, remove-add the new larger disk, repair-restore raid, then remove the other disk, install the second and (re)balance the entire raid1 on them!
Although this is out of scope, I use a stub archlinux UEFI kernel so I do not have grub and my entire rootfs is also encrypted and btrfs!
mount -o subvolid=10701 LABEL="ST1000DX002" /home
mount -o subvolid=10657 LABEL="ST1000DX002" /opt
Declare variables
# paths MUST end with '/'
btrfs_paths=("/" "/home/" "/opt/")
timestamp=$(date +%Y%m%d_%H%M%S)
keep_snapshots=3
yymmdd="$(date +%Y/%m/%d)"
logfile="/var/log/btrfsSnapshot/${yymmdd}/btrfsSnapshot.log"
The first variable in the script is actually a bash array
btrfs_paths=("/" "/home/" "/opt/")
and all three (3) paths (rootfs, home & opt) are different mount points on different encrypted disks.
MUST end with / (forward slash), either-wise something catastrophic will occur to your system. Be very careful. Please, be very careful!
Next variable is the timestamp we will use, that will create something like
partition_YYYYMMDD_HHMMSS
After that is how many snapshots we would like to keep to our system. You can increase it to whatever you like. But be careful of the storage.
keep_snapshots=3
I like using shortcuts in shell scripts to reduce the long one-liners that some people think that it is alright. I dont, so
yymmdd="$(date +%Y/%m/%d)"
is one of these shortcuts !
Last, I like to have a logfile to review at a later time and see what happened.
logfile="/var/log/btrfsSnapshot/${yymmdd}/btrfsSnapshot.log"
Log Directory
for older dudes -like me- you know that you can not have all your logs under one directory but you need to structure them. The above yymmdd shortcut can help here. As I am too lazy to check if the directory already exist, I just (re)create the log directory that the script will use.
sudo mkdir -p "/var/log/btrfsSnapshot/${yymmdd}/"
For - Loop
We enter to the crucial part of the script. We are going to iterate our btrfs commands in a bash for-loop structure so we can run the same commands for all our partitions (variable: btrfs_paths)
for btrfs_path in "${btrfs_paths[@]}"; do
    <some commands>
done
Snapshot Directory
We need to have our snapshots in a specific location. So I chose .Snapshot/ under each partition. And I am silently (re)creating this directory -again I am lazy, someone should check if the directory/path already exist- just to be sure that the directory exist.
sudo mkdir -p "${btrfs_path}".Snapshot/
I am also using very frequently mlocate (updatedb) so to avoid having multiple (duplicates) in your index, do not forget to update updatedb.conf to exclude the snapshot directories.
PRUNENAMES = ".Snapshot"How many snapshots are there?
Yes, how many ?
In order to learn this, we need to count them. I will try to skip every other subvolume that exist under the path and count only the read-only, snapshots under each partition.
sudo btrfs subvolume list -o -r -s "${btrfs_path}" | grep -c ".Snapshot/"
Delete Previous snapshots
At this point in the script, we are ready to delete all previous snapshots and only keep the latest or to be exact whatever the keep_snapshots variables says we should keep.
To do that, we are going to iterate via a while-loop (this is a nested loop inside the above for-loop)
while [ "${keep_snapshots}" -le "${list_btrfs_snap}" ]
do
  <some commands>
done
considering that the keep_snapshots is an integer, we iterate the delete command less or equal from the list of already btrfs existing snapshots.
Delete Command
To avoid mistakes, we delete by subvolume id and not by the name of the snapshot, under the btrfs path we listed above.
btrfs subvolume delete --subvolid "${prev_btrfs_snap}" "${btrfs_path}"and we log the output of the command into our log
Delete subvolume (no-commit): '//.Snapshot/20221107_091028'
Create a new subvolume snapshot
And now we are going to create a new read-only snapshot under our btrfs subvolume.
btrfs subvolume snapshot -r "${btrfs_path}" "${btrfs_path}.Snapshot/${timestamp}"
the log entry will have something like:
Create a readonly snapshot of '/' in '/.Snapshot/20221111_000001'
That’s it !
Output
Log Directory Structure and output
sudo tree /var/log/btrfsSnapshot/2022/11/
/var/log/btrfsSnapshot/2022/11/
├── 07
│   └── btrfsSnapshot.log
├── 10
│   └── btrfsSnapshot.log
├── 11
│   └── btrfsSnapshot.log
└── 18
    └── btrfsSnapshot.log

4 directories, 4 files
sudo cat /var/log/btrfsSnapshot/2022/11/18/btrfsSnapshot.log
######## Fri, 18 Nov 2022 00:00:01 +0200 ########

Delete subvolume (no-commit): '//.Snapshot/20221107_091040'
Create a readonly snapshot of '/' in '/.Snapshot/20221118_000001'

Delete subvolume (no-commit): '/home//home/.Snapshot/20221107_091040'
Create a readonly snapshot of '/home/' in '/home/.Snapshot/20221118_000001'

Delete subvolume (no-commit): '/opt//opt/.Snapshot/20221107_091040'
Create a readonly snapshot of '/opt/' in '/opt/.Snapshot/20221118_000001'
Mount a read-only subvolume
As something extra for this article, I will mount a read-only subvolume, so you can see how it is done.
$ sudo btrfs subvolume list -o -r -s /

ID 462 gen 5809766 cgen 5809765 top level 5 otime 2022-11-10 18:11:20 path .Snapshot/20221110_181120
ID 463 gen 5810106 cgen 5810105 top level 5 otime 2022-11-11 00:00:01 path .Snapshot/20221111_000001
ID 464 gen 5819886 cgen 5819885 top level 5 otime 2022-11-18 00:00:01 path .Snapshot/20221118_000001

$ sudo mount -o subvolid=462 /media/
mount: /media/: can't find in /etc/fstab.

$ sudo mount -o subvolid=462 LABEL=rootfs /media/

$ df -HP /media/
Filesystem       Size  Used Avail Use% Mounted on
/dev/mapper/ssd  112G  9.1G  102G   9% /media

$ sudo touch /media/etc/ebal
touch: cannot touch '/media/etc/ebal': Read-only file system

$ sudo diff /etc/pacman.d/mirrorlist /media/etc/pacman.d/mirrorlist

294c294
< Server = http://ftp.ntua.gr/pub/linux/archlinux/$repo/os/$arch
---
> #Server = http://ftp.ntua.gr/pub/linux/archlinux/$repo/os/$arch

$ sudo umount /media
The Script
Last, but not least, the full script as was the date of this article.
#!/bin/bash
set -e

# ebal, Mon, 07 Nov 2022 08:49:37 +0200

## 0 0 * * Fri /usr/local/bin/btrfsSnapshot.sh

# paths MUST end with '/'
btrfs_paths=("/" "/home/" "/opt/")
timestamp=$(date +%Y%m%d_%H%M%S)
keep_snapshots=3
yymmdd="$(date +%Y/%m/%d)"
logfile="/var/log/btrfsSnapshot/${yymmdd}/btrfsSnapshot.log"

sudo mkdir -p "/var/log/btrfsSnapshot/${yymmdd}/"

echo "######## $(date -R) ########" | sudo tee -a "${logfile}"
echo "" | sudo tee -a "${logfile}"

for btrfs_path in "${btrfs_paths[@]}"; do

    ## Create Snapshot directory
    sudo mkdir -p "${btrfs_path}".Snapshot/

    ## How many Snapshots are there ?
    list_btrfs_snap=$(sudo btrfs subvolume list -o -r -s "${btrfs_path}" | grep -c ".Snapshot/")

    ## Get oldest rootfs btrfs snapshot
    while [ "${keep_snapshots}" -le "${list_btrfs_snap}" ]
    do
        prev_btrfs_snap=$(sudo btrfs subvolume list -o -r -s  "${btrfs_path}" | grep ".Snapshot/" | sort | head -1 | awk '{print $2}')

        ## Delete a btrfs snapshot by their subvolume id
        sudo btrfs subvolume delete --subvolid "${prev_btrfs_snap}" "${btrfs_path}" | sudo tee -a "${logfile}"

        list_btrfs_snap=$(sudo btrfs subvolume list -o -r -s "${btrfs_path}" | grep -c ".Snapshot/")
    done

    ## Create a new read-only btrfs snapshot
    sudo btrfs subvolume snapshot -r "${btrfs_path}" "${btrfs_path}.Snapshot/${timestamp}" | sudo tee -a "${logfile}"

    echo "" | sudo tee -a "${logfile}"

done
When creating a new Cloud Virtual Machine the cloud provider is copying a virtual disk as the base image (we called it mí̱tra or matrix) and starts your virtual machine from another virtual disk (or volume cloud disk) that in fact is a snapshot of the base image.
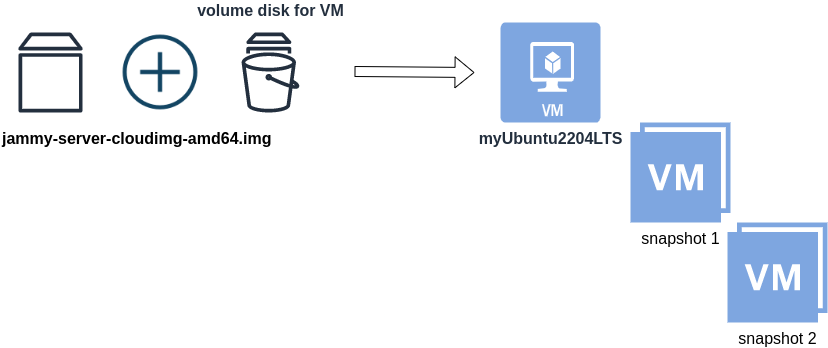
Just for the sake of this example, let us say that the base cloud image is the
jammy-server-cloudimg-amd64.imgWhen creating a new Libvirt (qemu/kvm) virtual machine, you can use this base image to start your VM instead of using an iso to install ubuntu 22.04 LTS. When choosing this image, then all changes will occur to that image and if you want to spawn another virtual machine, you need to (re)download it.
So instead of doing that, the best practice is to copy this image as base and start from a snapshot aka a baking file from that image. It is best because you can always quickly revert all your changes and (re)spawn the VM from the fresh/clean base image. Or you can always create another snapshot and revert if needed.
inspect images
To see how that works here is a local example from my linux machine.
qemu-img info /var/lib/libvirt/images/lEvXLA_tf-base.qcow2
image: /var/lib/libvirt/images/lEvXLA_tf-base.qcow2
file format: qcow2
virtual size: 2.2 GiB (2361393152 bytes)
disk size: 636 MiB
cluster_size: 65536
Format specific information:
    compat: 0.10
    compression type: zlib
    refcount bits: 16
the most important attributes to inspect are
virtual size: 2.2 GiB
disk size: 636 MiB
and the volume disk of my virtual machine
qemu-img info /var/lib/libvirt/images/lEvXLA_tf-vol.qcow2
image: /var/lib/libvirt/images/lEvXLA_tf-vol.qcow2
file format: qcow2
virtual size: 10 GiB (10737418240 bytes)
disk size: 1.6 GiB
cluster_size: 65536
backing file: /var/lib/libvirt/images/lEvXLA_tf-base.qcow2
backing file format: qcow2
Format specific information:
    compat: 0.10
    compression type: zlib
    refcount bits: 16
We see here
virtual size: 10 GiB
disk size: 1.6 GiB
cause I have extended the volume disk size to 10G from 2.2G , doing some updates and install some packages.
Now here is a problem.
I would like to use my own cloud image as base for some projects. It will help me speed things up and also do some common things I am usually doing in every setup.
If I copy the volume disk, then I will copy 1.6G of the snapshot disk. I can not use this as a base image. The volume disk contains only the delta from the base image!
baking file
Let’s first understand a bit better what is happening here
qemu-img info –backing-chain /var/lib/libvirt/images/lEvXLA_tf-vol.qcow2
image: /var/lib/libvirt/images/lEvXLA_tf-vol.qcow2
file format: qcow2
virtual size: 10 GiB (10737418240 bytes)
disk size: 1.6 GiB
cluster_size: 65536
backing file: /var/lib/libvirt/images/lEvXLA_tf-base.qcow2
backing file format: qcow2
Format specific information:
    compat: 0.10
    compression type: zlib
    refcount bits: 16

image: /var/lib/libvirt/images/lEvXLA_tf-base.qcow2
file format: qcow2
virtual size: 2.2 GiB (2361393152 bytes)
disk size: 636 MiB
cluster_size: 65536
Format specific information:
    compat: 0.10
    compression type: zlib
    refcount bits: 16
By inspecting the volume disk, we see that this image is chained to our base image.
disk size: 1.6 GiB
disk size: 636 MiB
Commit Volume
If we want to commit our volume changes to our base images, we need to commit them.
sudo qemu-img commit /var/lib/libvirt/images/lEvXLA_tf-vol.qcow2

Image committed.
Be aware, we commit our changes the volume disk => so our base will get the updates !!
Base Image
We need to see our base image grow we our changes
  disk size: 1.6 GiB
+ disk size: 636 MiB
=
  disk size: 2.11 GiB
and we can verify that by getting the image info (details)
qemu-img info /var/lib/libvirt/images/lEvXLA_tf-base.qcow2
image: /var/lib/libvirt/images/lEvXLA_tf-base.qcow2
file format: qcow2
virtual size: 10 GiB (10737418240 bytes)
disk size: 2.11 GiB
cluster_size: 65536
Format specific information:
    compat: 0.10
    compression type: zlib
    refcount bits: 16
That’s it !
Using Terraform for personal projects, is a good way to create your lab in a reproducible manner. Wherever your lab is, either in the “cloud” aka other’s people computers or in a self-hosted environment, you can run your Infrastructure as code (IaC) instead of performing manual tasks each time.
My preferable way is to use QEMU/KVM (Kernel Virtual Machine) on my libvirt (self-hosted) lab. You can quickly build a k8s cluster or test a few virtual machines with different software, without paying extra money to cloud providers.
Terraform uses a state file to store your entire infra in json format. This file will be the source of truth for your infrastructure. Any changes you make in the code, terraform will figure out what needs to add/destroy and run only what have changed.
Working in a single repository, terraform will create a local state file on your working directory. This is fast and reliable when working alone. When working with a team (either in an opensource project/service or it is something work related) you need to share the state with others. Eitherwise the result will be catastrophic as each person will have no idea of the infrastructure state of the service.
In this blog post, I will try to explain how to use GitLab to store the terraform state into a remote repository by using the tf backend: http which is REST.
Greate a new private GitLab Project
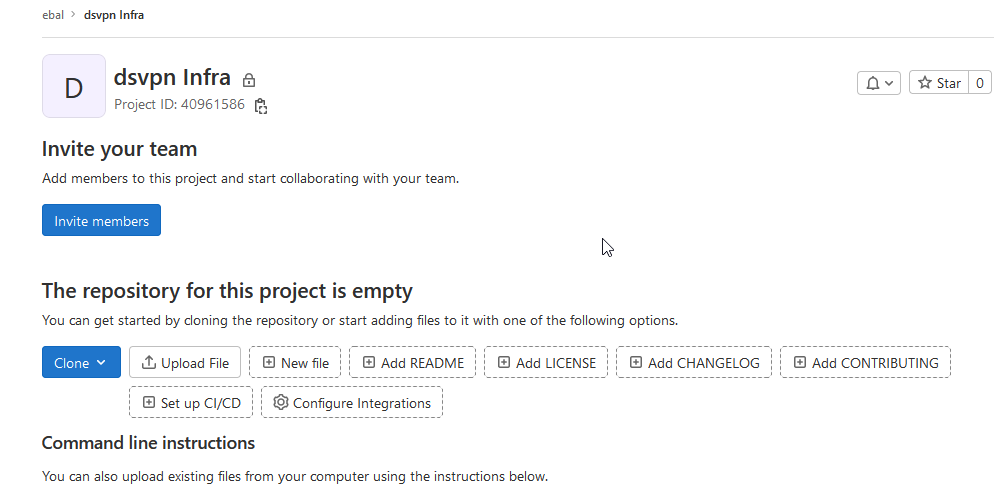
We need the Project ID which is under the project name in the top.
Create a new api token
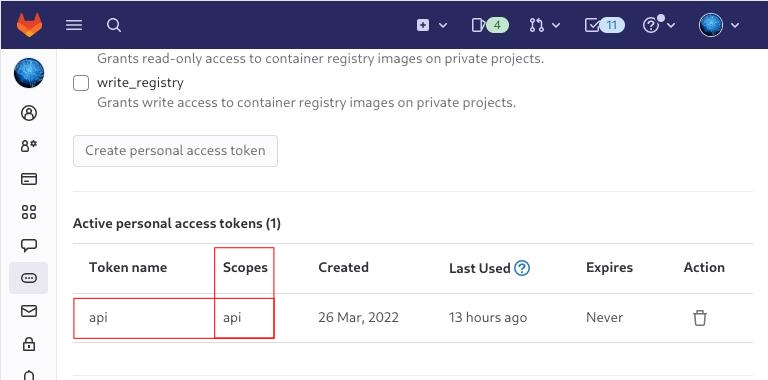
Verify that your Project has the ability to store terraform state files
You are ready to clone the git repository to your system.
Backend
Reading the documentation in the below links
seems that the only thing we need to do, is to expand our terraform project with this:
terraform {
  backend "http" {
  }
}
Doing that, we inform our IaC that our terraform backend should be a remote address.
Took me a while to figure this out, but after re-reading all the necessary documentation materials the idea is to declare your backend on gitlab and to do this, we need to initialize the http backend.
The only Required configuration setting is the remote address and should be something like this:
terraform {
  backend "http" {
    address = "https://gitlab.com/api/v4/projects/<PROJECT_ID>/terraform/state/<STATE_NAME>"
  }
}
Where PROJECT_ID and STATE_NAME are relative to your project.
In this article, we go with
GITLAB_PROJECT_ID="40961586"
GITLAB_TF_STATE_NAME="tf_state"
Terraform does not allow to use variables in the backend http, so the preferable way is to export them to our session.
and we -of course- need the address:
TF_HTTP_ADDRESS="https://gitlab.com/api/v4/projects/${GITLAB_PROJECT_ID}/terraform/state/${GITLAB_TF_STATE_NAME}"
For convience reasons, I will create a file named: terraform.config outside of this git repo
cat > ../terraform.config <<EOF
export -p GITLAB_PROJECT_ID="40961586"
export -p GITLAB_TF_STATE_NAME="tf_state"
export -p GITLAB_URL="https://gitlab.com/api/v4/projects"

# Address
export -p TF_HTTP_ADDRESS="${GITLAB_URL}/${GITLAB_PROJECT_ID}/terraform/state/${GITLAB_TF_STATE_NAME}"

EOF

source ../terraform.config
this should do the trick.
Authentication
In order to authenticate via tf against GitLab to store the tf remote state, we need to also set two additional variables:
# Authentication
TF_HTTP_USERNAME="api"
TF_HTTP_PASSWORD="<TOKEN>"
put them in the above terraform.config file.
Pretty much we are done!
Initialize Terraform
source ../terraform.config

terraform init
Initializing the backend...

Successfully configured the backend "http"! Terraform will automatically
use this backend unless the backend configuration changes.

Initializing provider plugins...
- Finding latest version of hashicorp/http...
- Finding latest version of hashicorp/random...
- Finding latest version of hashicorp/template...
- Finding dmacvicar/libvirt versions matching ">= 0.7.0"...
- Installing hashicorp/random v3.4.3...
- Installed hashicorp/random v3.4.3 (signed by HashiCorp)
- Installing hashicorp/template v2.2.0...
- Installed hashicorp/template v2.2.0 (signed by HashiCorp)
- Installing dmacvicar/libvirt v0.7.0...
- Installed dmacvicar/libvirt v0.7.0 (unauthenticated)
- Installing hashicorp/http v3.2.1...
- Installed hashicorp/http v3.2.1 (signed by HashiCorp)

Terraform has created a lock file .terraform.lock.hcl to record the provider
selections it made above. Include this file in your version control repository
so that Terraform can guarantee to make the same selections by default when
you run "terraform init" in the future.

...

Terraform has been successfully initialized!

You may now begin working with Terraform. Try running "terraform plan" to see
any changes that are required for your infrastructure. All Terraform commands
should now work.

If you ever set or change modules or backend configuration for Terraform,
rerun this command to reinitialize your working directory. If you forget, other
commands will detect it and remind you to do so if necessary.
Remote state
by running
terraform plan
we can now see the remote terraform state in the gitlab
Opening Actions –> Copy terraform init command we can see the below configuration:
export GITLAB_ACCESS_TOKEN=<YOUR-ACCESS-TOKEN>

terraform init
    -backend-config="address=https://gitlab.com/api/v4/projects/40961586/terraform/state/tf_state"
    -backend-config="lock_address=https://gitlab.com/api/v4/projects/40961586/terraform/state/tf_state/lock"
    -backend-config="unlock_address=https://gitlab.com/api/v4/projects/40961586/terraform/state/tf_state/lock"
    -backend-config="username=api"
    -backend-config="password=$GITLAB_ACCESS_TOKEN"
    -backend-config="lock_method=POST"
    -backend-config="unlock_method=DELETE"
    -backend-config="retry_wait_min=5"
Update terraform backend configuration
I dislike running a “long” terraform init command, so we will put these settings to our tf code.
Separating the static changes from the dynamic, our Backend http config can become something like this:
terraform {
  backend "http" {
    lock_method    = "POST"
    unlock_method  = "DELETE"
    retry_wait_min = 5
  }
}
but we need to update our terraform.config once more, to include all the variables of the http backend configuration for locking and unlocking the state.
# Lock
export -p TF_HTTP_LOCK_ADDRESS="${TF_HTTP_ADDRESS}/lock"

# Unlock
export -p TF_HTTP_UNLOCK_ADDRESS="${TF_HTTP_ADDRESS}/lock"
Terraform Config
So here is our entire terraform config file
# GitLab

export -p GITLAB_URL="https://gitlab.com/api/v4/projects"
export -p GITLAB_PROJECT_ID="<>"
export -p GITLAB_TF_STATE_NAME="tf_state"

# Terraform

# Address
export -p TF_HTTP_ADDRESS="${GITLAB_URL}/${GITLAB_PROJECT_ID}/terraform/state/${GITLAB_TF_STATE_NAME}"

# Lock
export -p TF_HTTP_LOCK_ADDRESS="${TF_HTTP_ADDRESS}/lock"

# Unlock
export -p TF_HTTP_UNLOCK_ADDRESS="${TF_HTTP_ADDRESS}/lock"

# Authentication
export -p TF_HTTP_USERNAME="api"
export -p TF_HTTP_PASSWORD="<>"
And pretty much that’s it!
Other Colleagues
So in order our team mates/colleagues want to make changes to this specific gitlab repo (or even extended to include a pipeline) they need
- Git clone the repo
- Edit the terraform.config
- Initialize terraform (terraform init)
And terraform will use the remote state file.